AWS Integration Dashboard in DDI Central
AWS Integration Dashboard in DDI Central
DDI Central’s AWS integration dashboard provides network administrators a centralized, visual snapshot of their AWS resource landscape across VPC, EC2, ECS, and RDS services. This guide outlines how to interpret and navigate through each of the visualizations in the dashboard.
1. Dashboard Overview
Upon navigating to the IPAM menu within the Cloud Observability type of cluster in DDI Central, you land on the Dashboard that offers a summary view of your AWS infrastructure. This includes four primary resource tiles:
- VPC: Number of Virtual Private Clouds
- EC2: Instance, Elastic IPs, and Load Balancer count
- ECS: Cluster and Task Definition count
- RDS: DB Cluster and DB Instance count
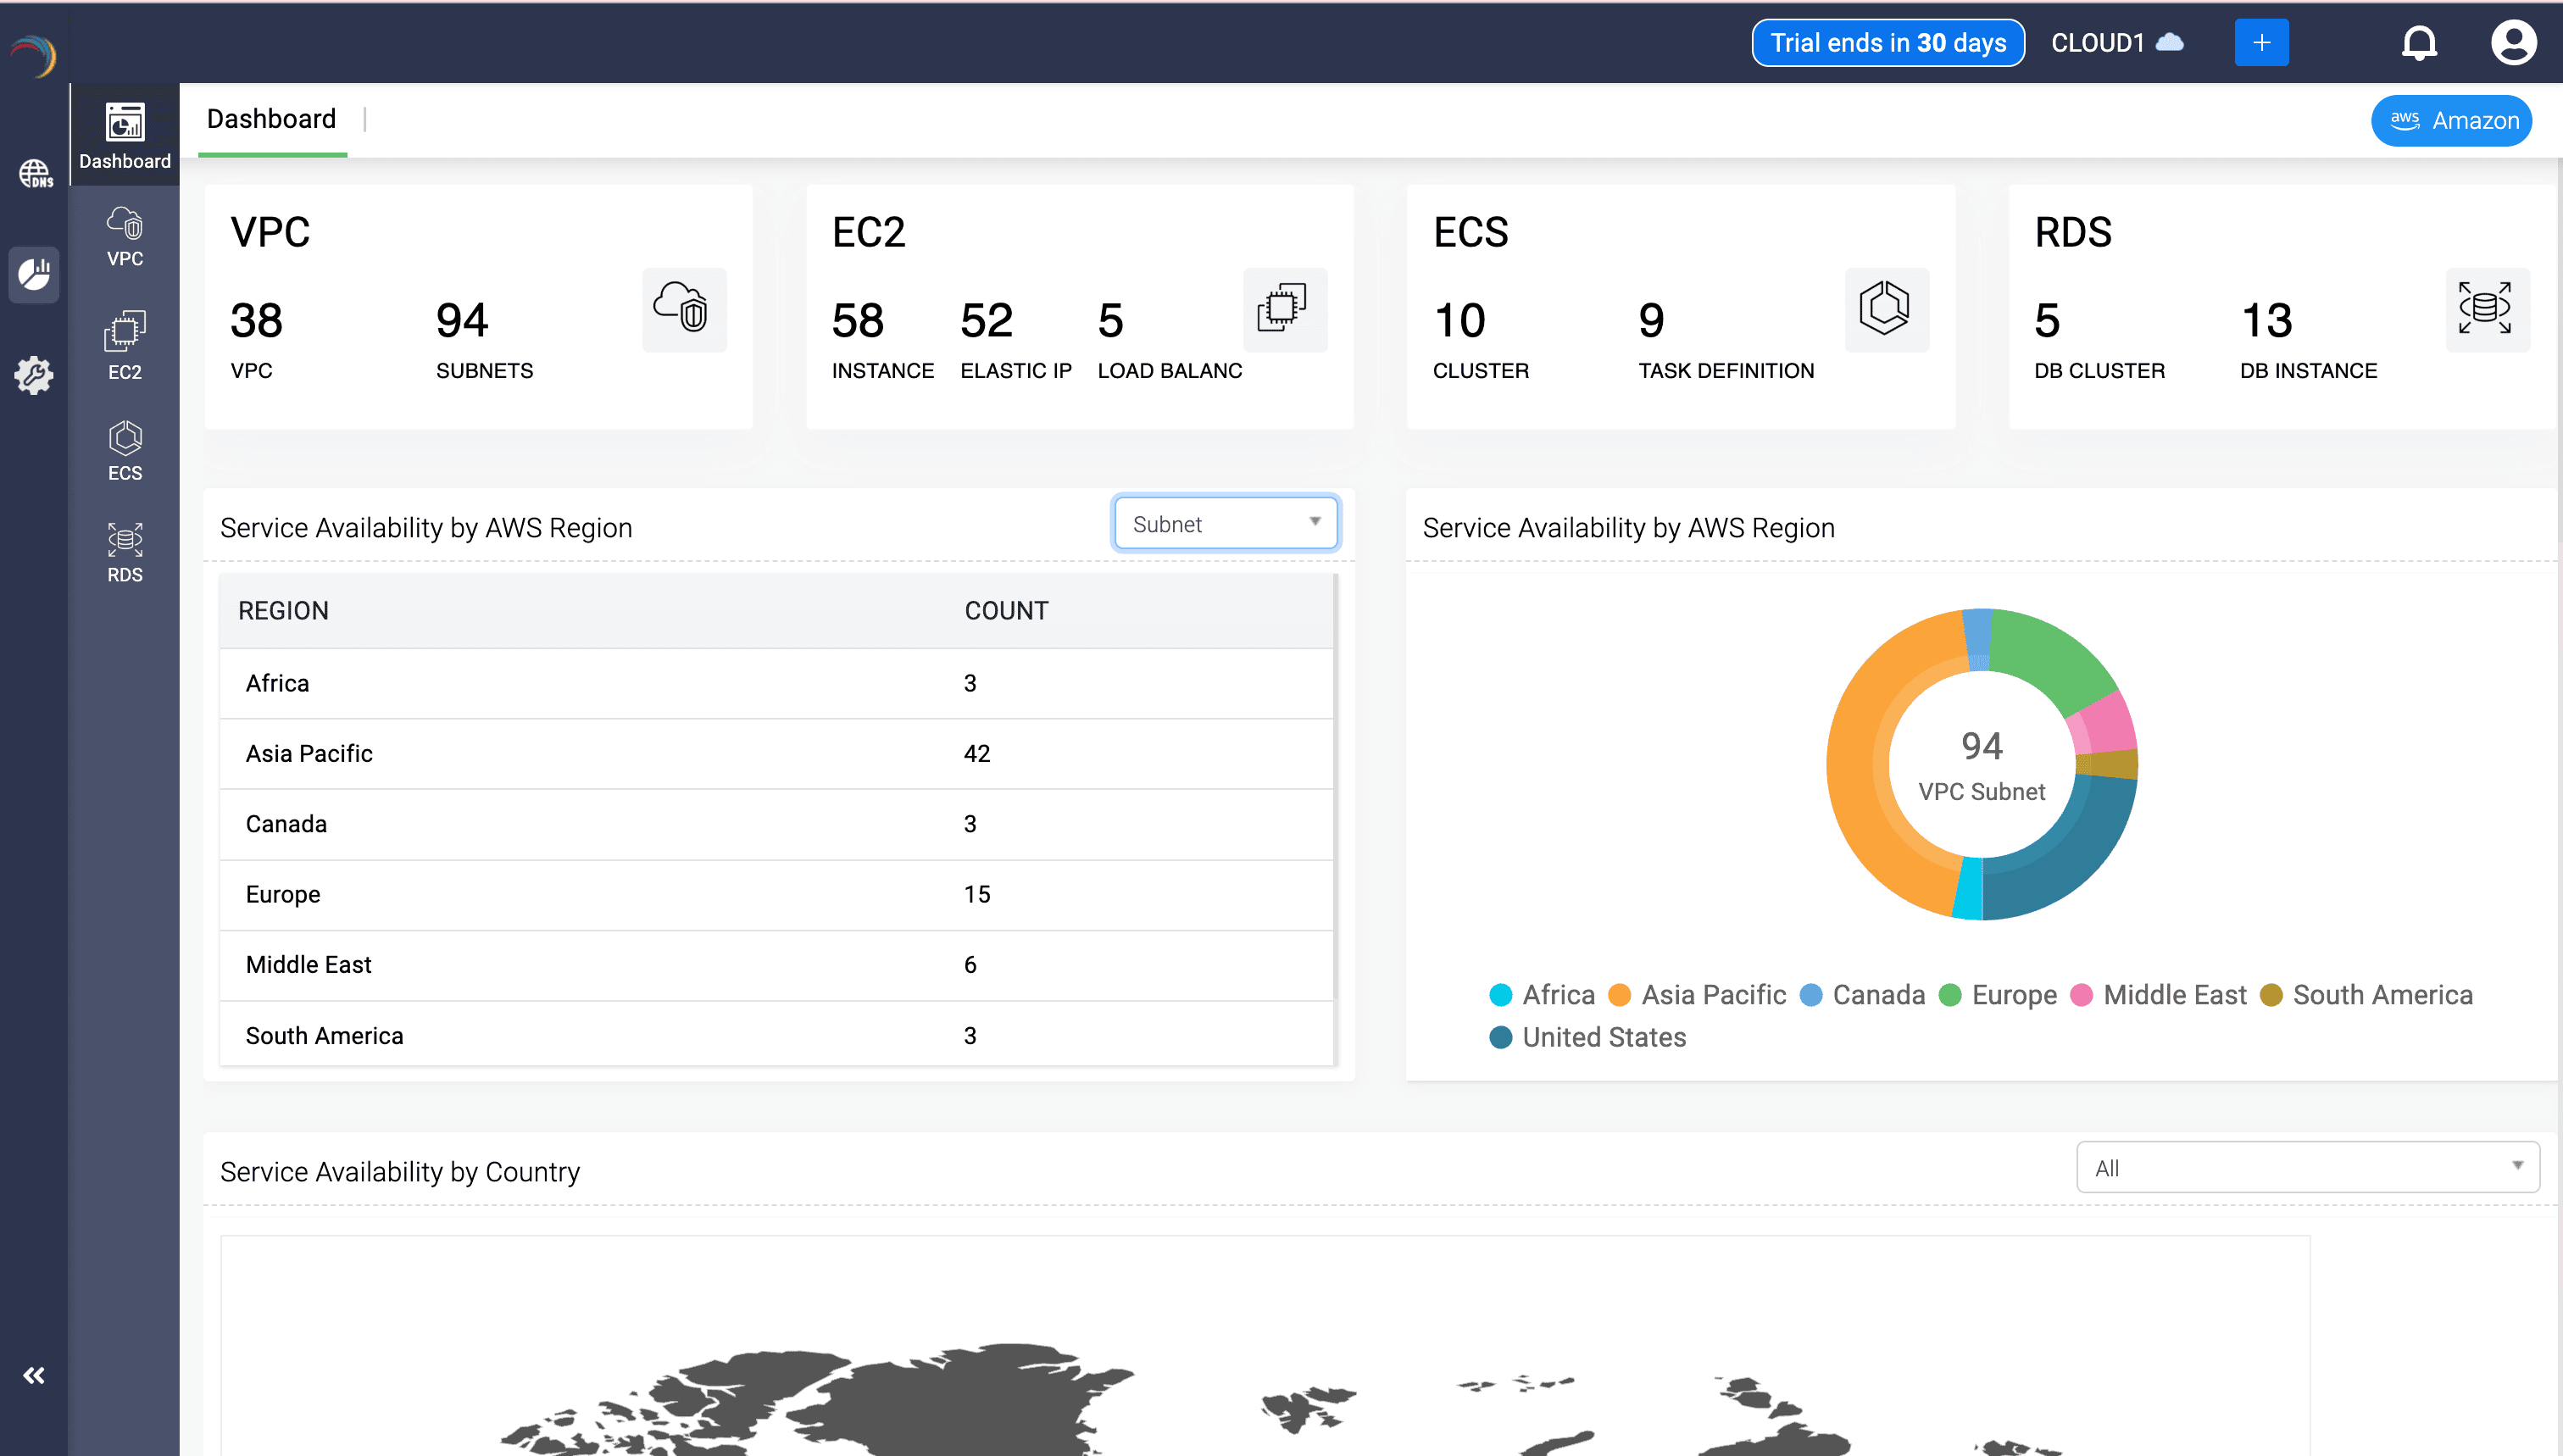
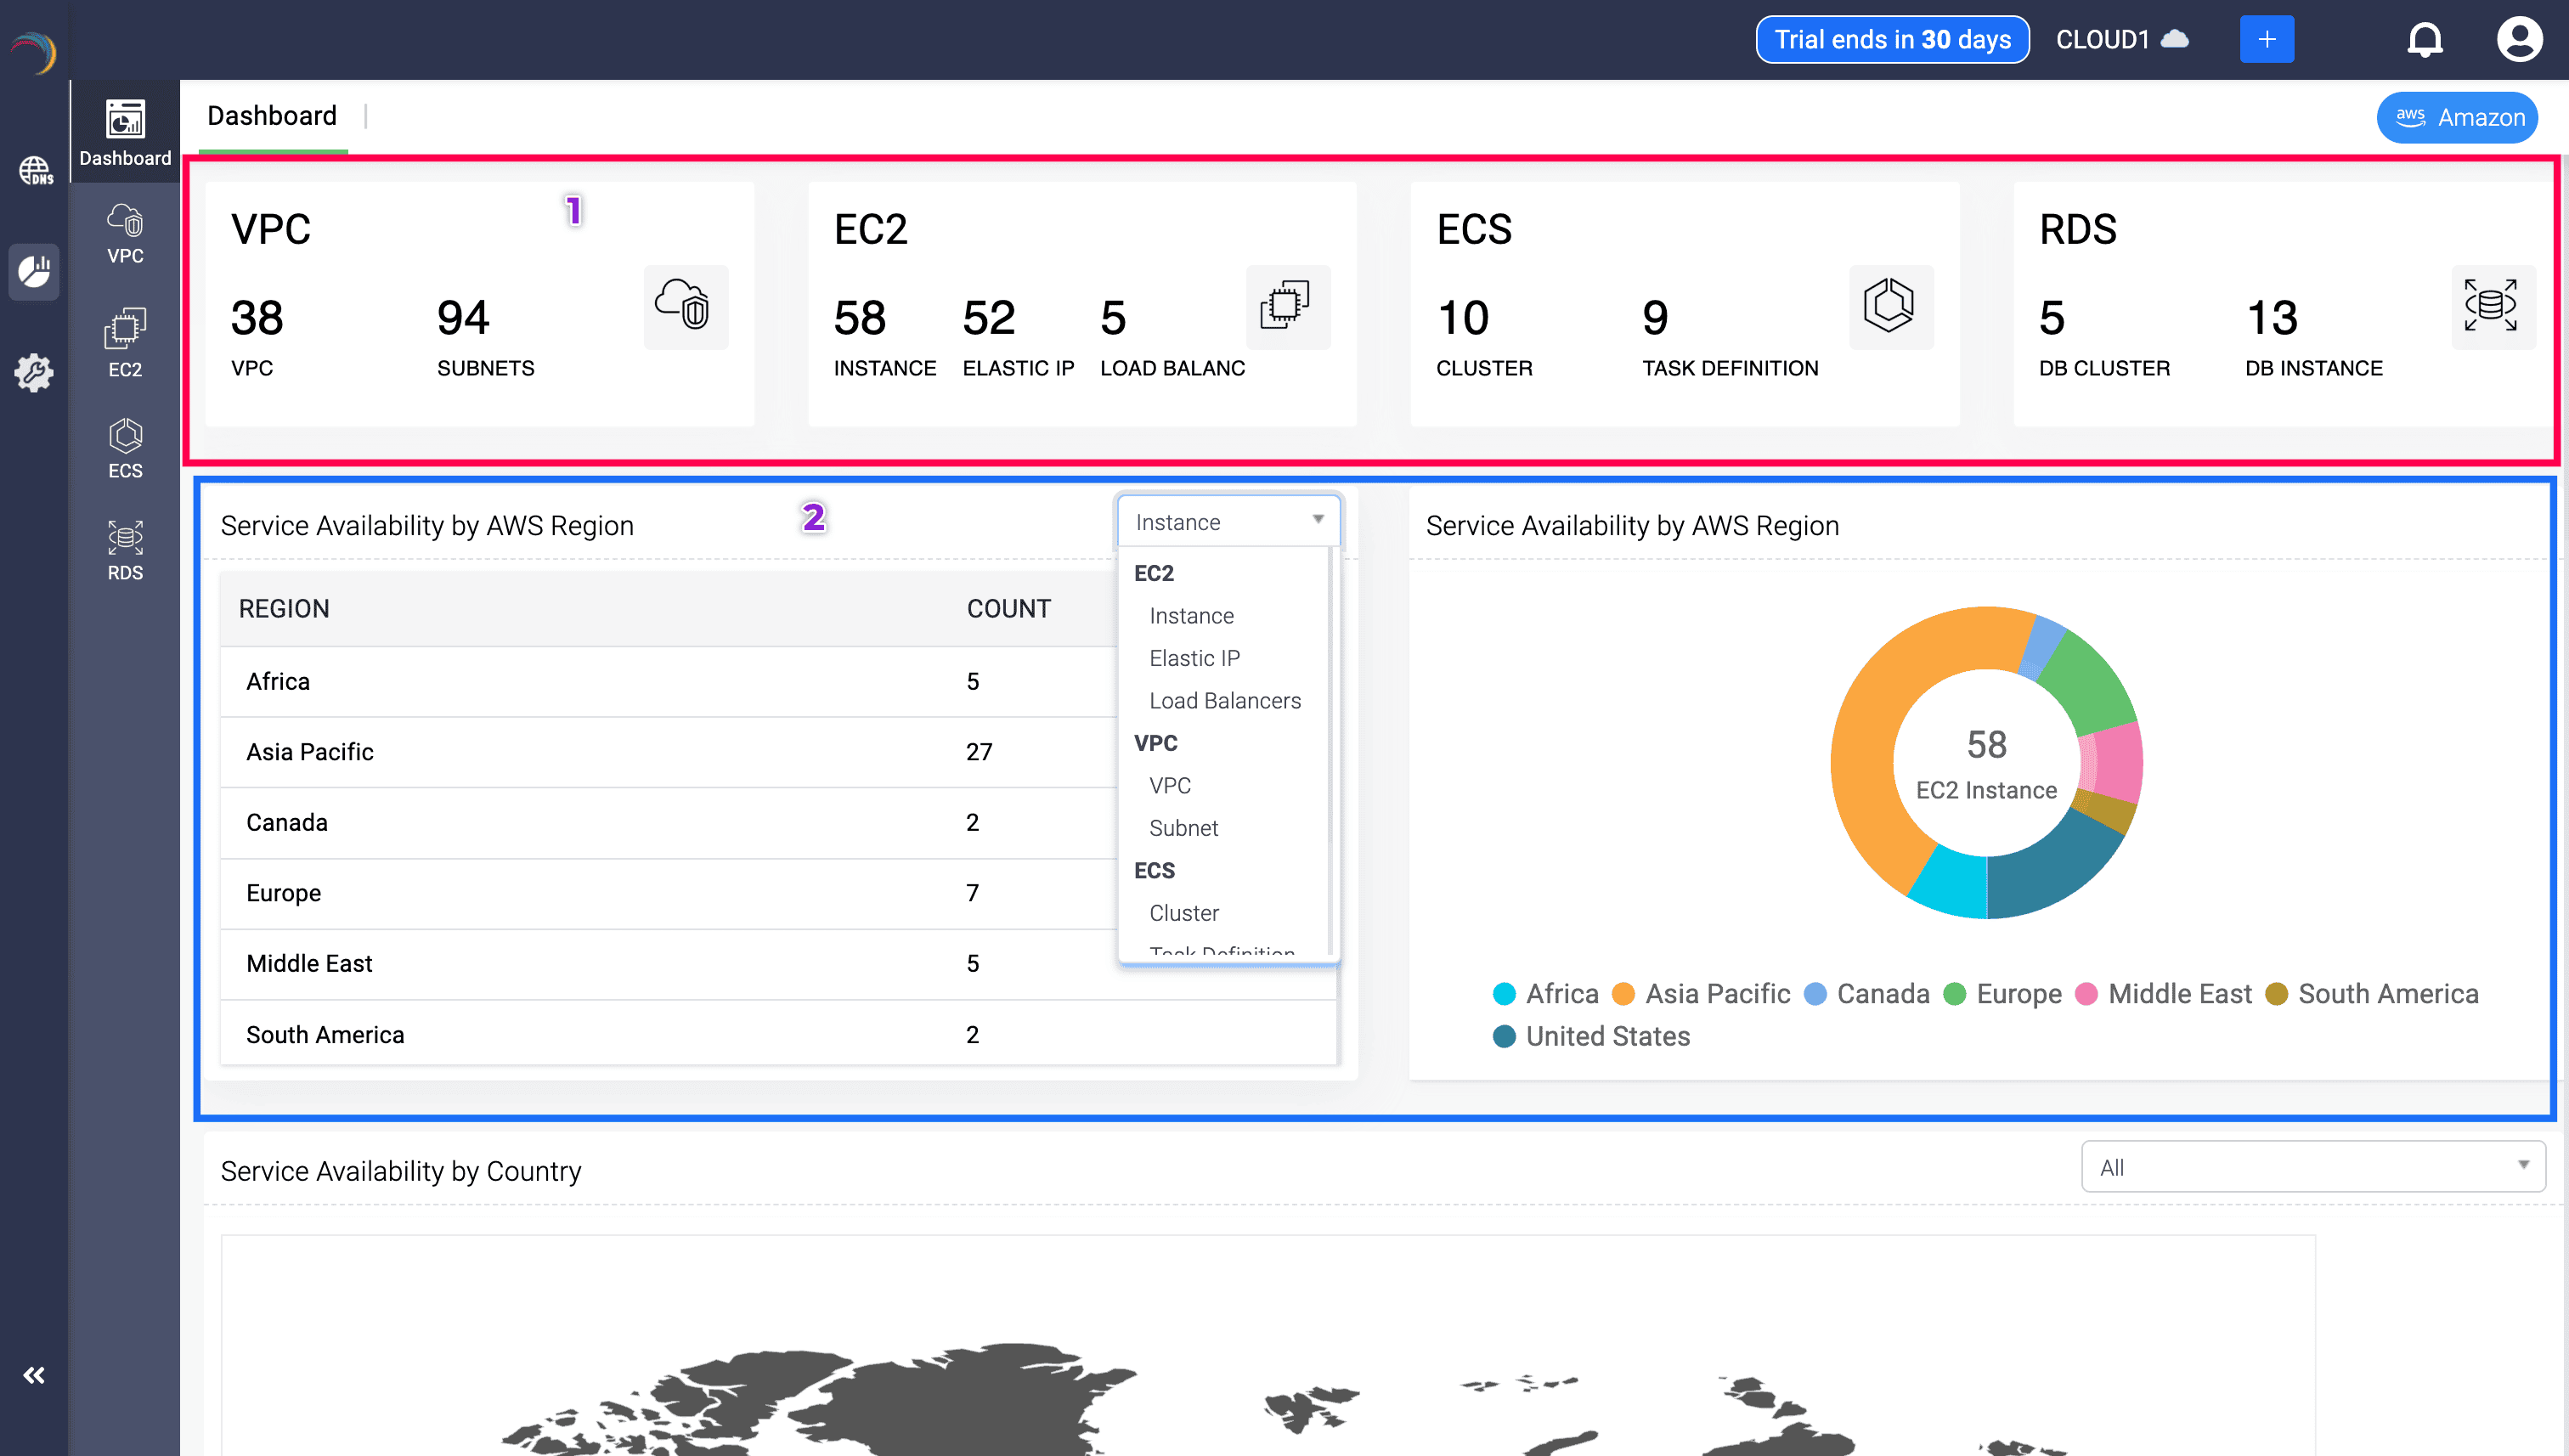
2. Service Availability by AWS Region (Region-wise Table & Donut Chart)
This section dynamically changes based on the AWS resource type selected from the dropdown (Instance, VPC, Subnet, etc.).
How to use:
- Use the dropdown to switch between EC2 Instance, Elastic IP, Load Balancer, VPC, Subnet, Cluster, Task Definition, etc.
- The left-side table displays a count of selected resources across AWS regions (e.g., Asia Pacific, Europe).
- The donut chart on the right provides a quick visual snapshot of this distribution for easier data interpretation.
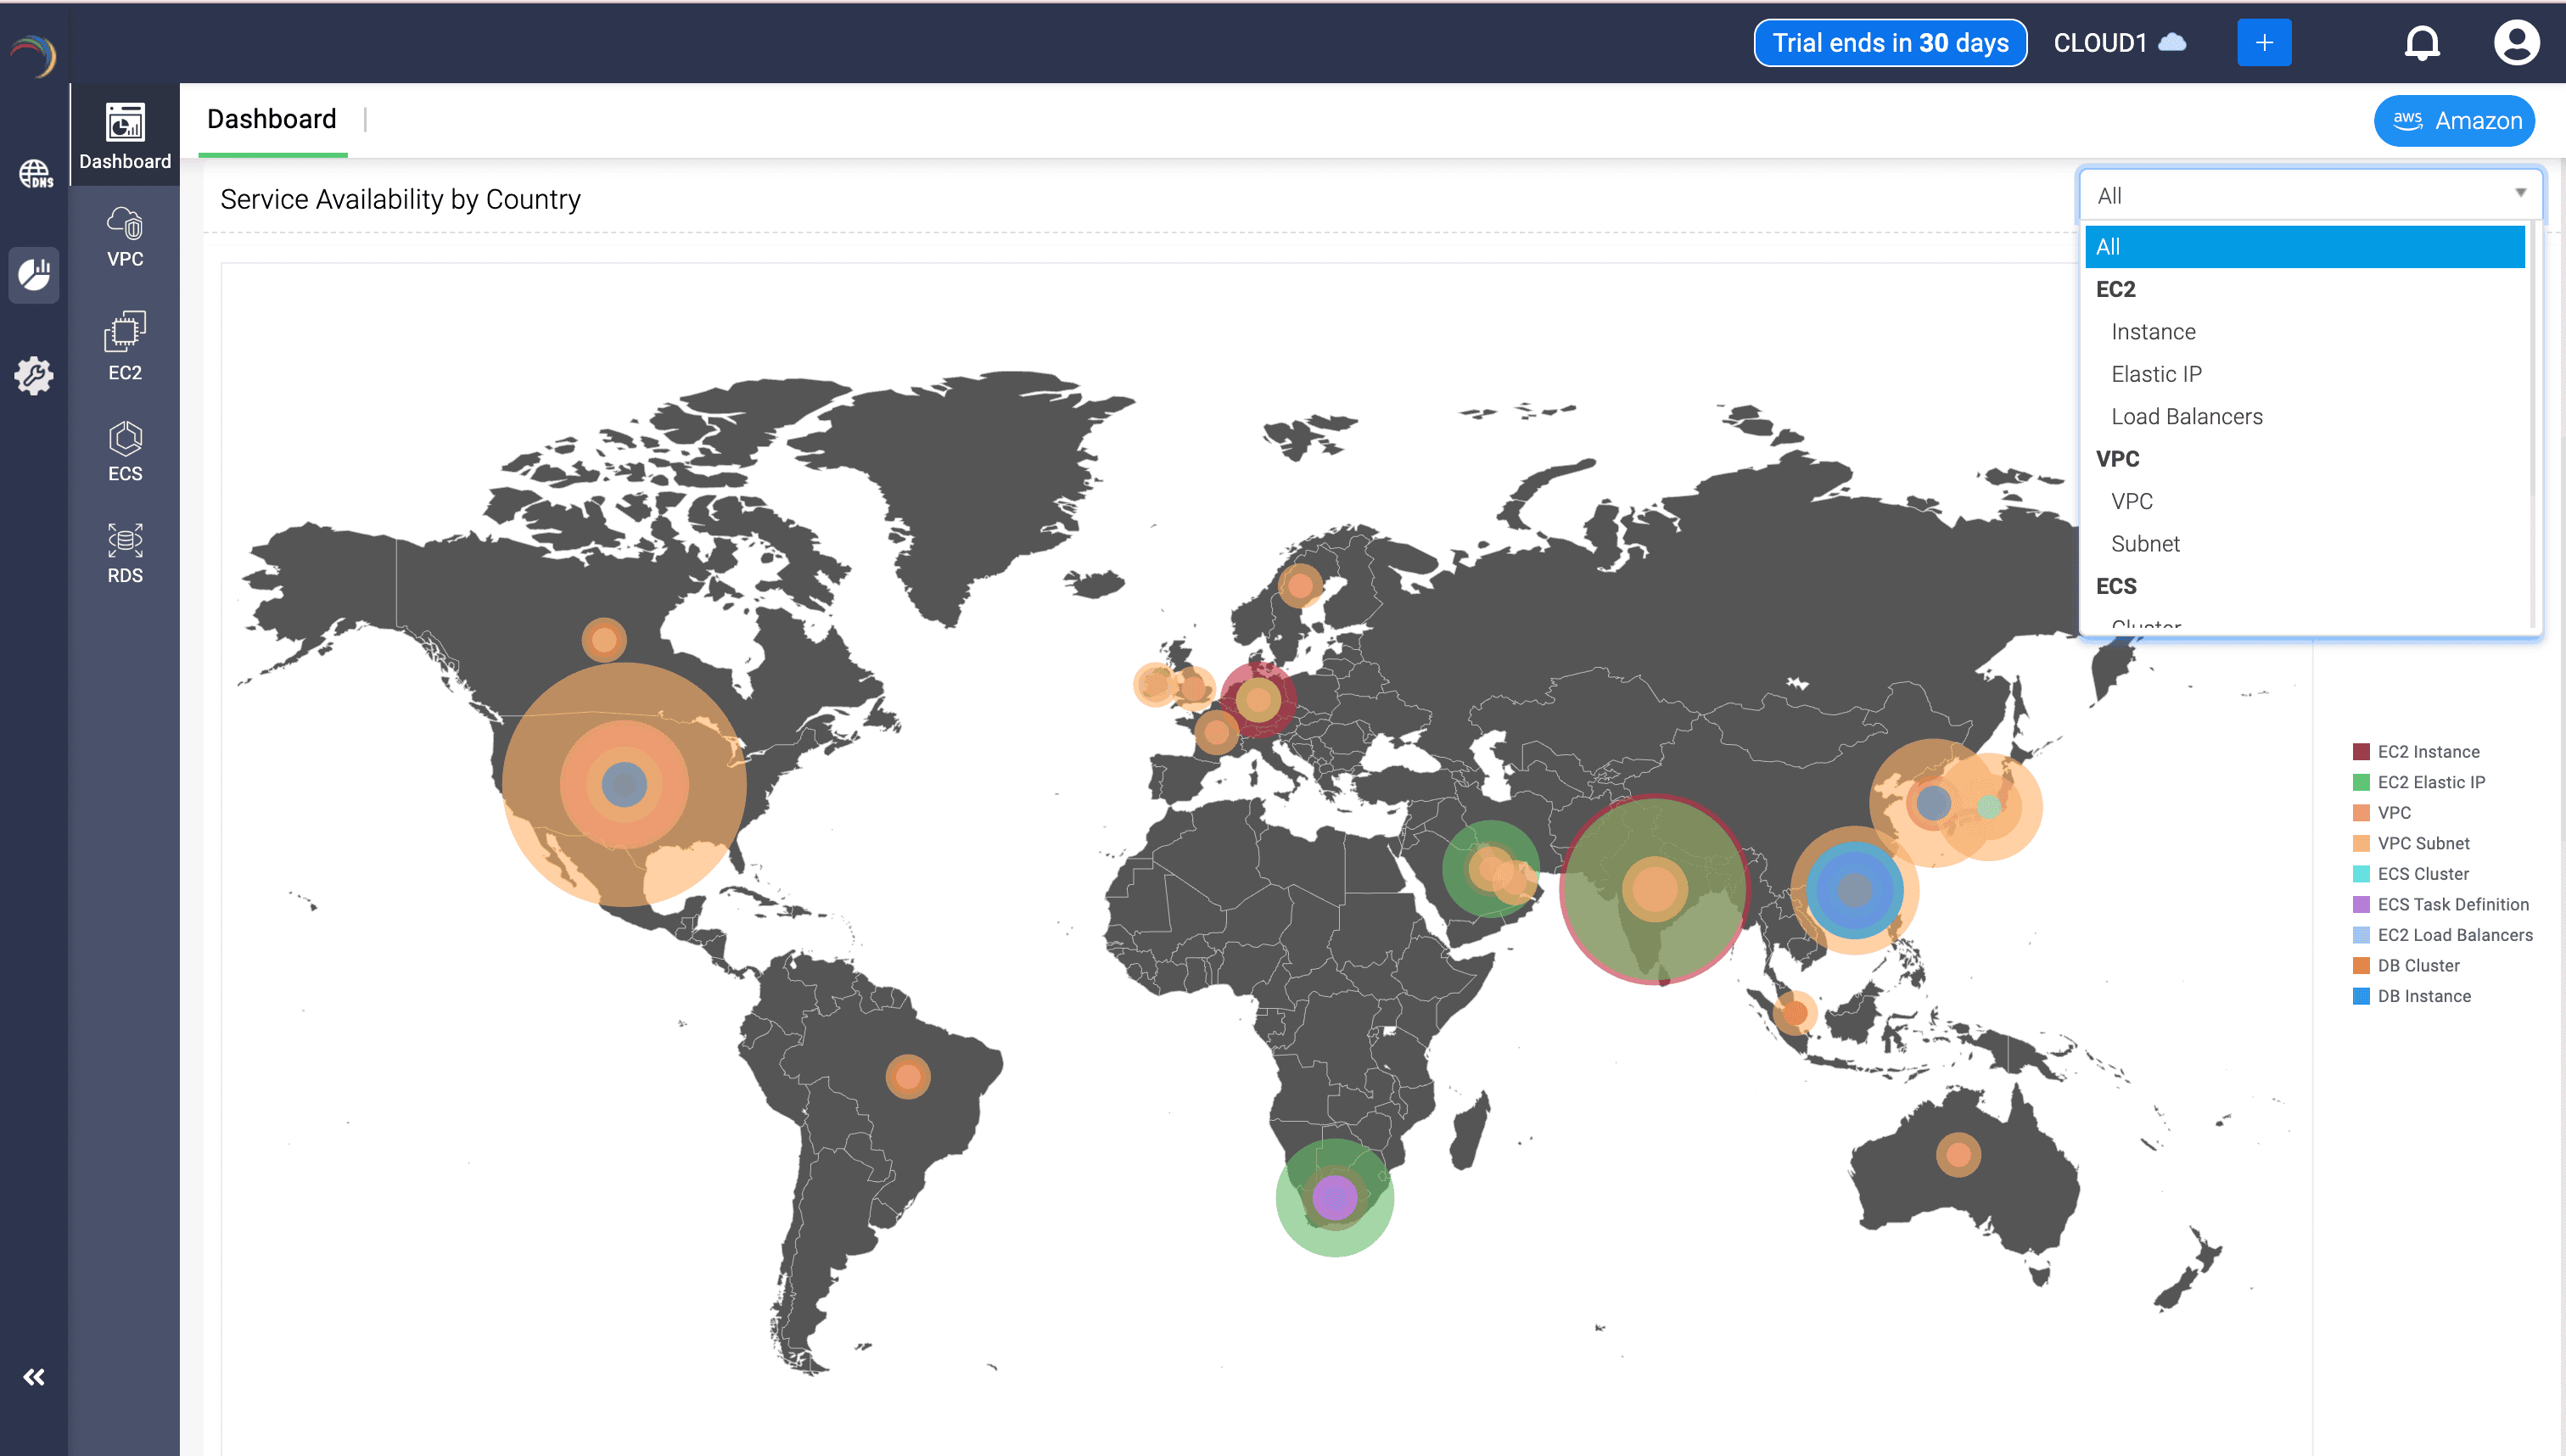
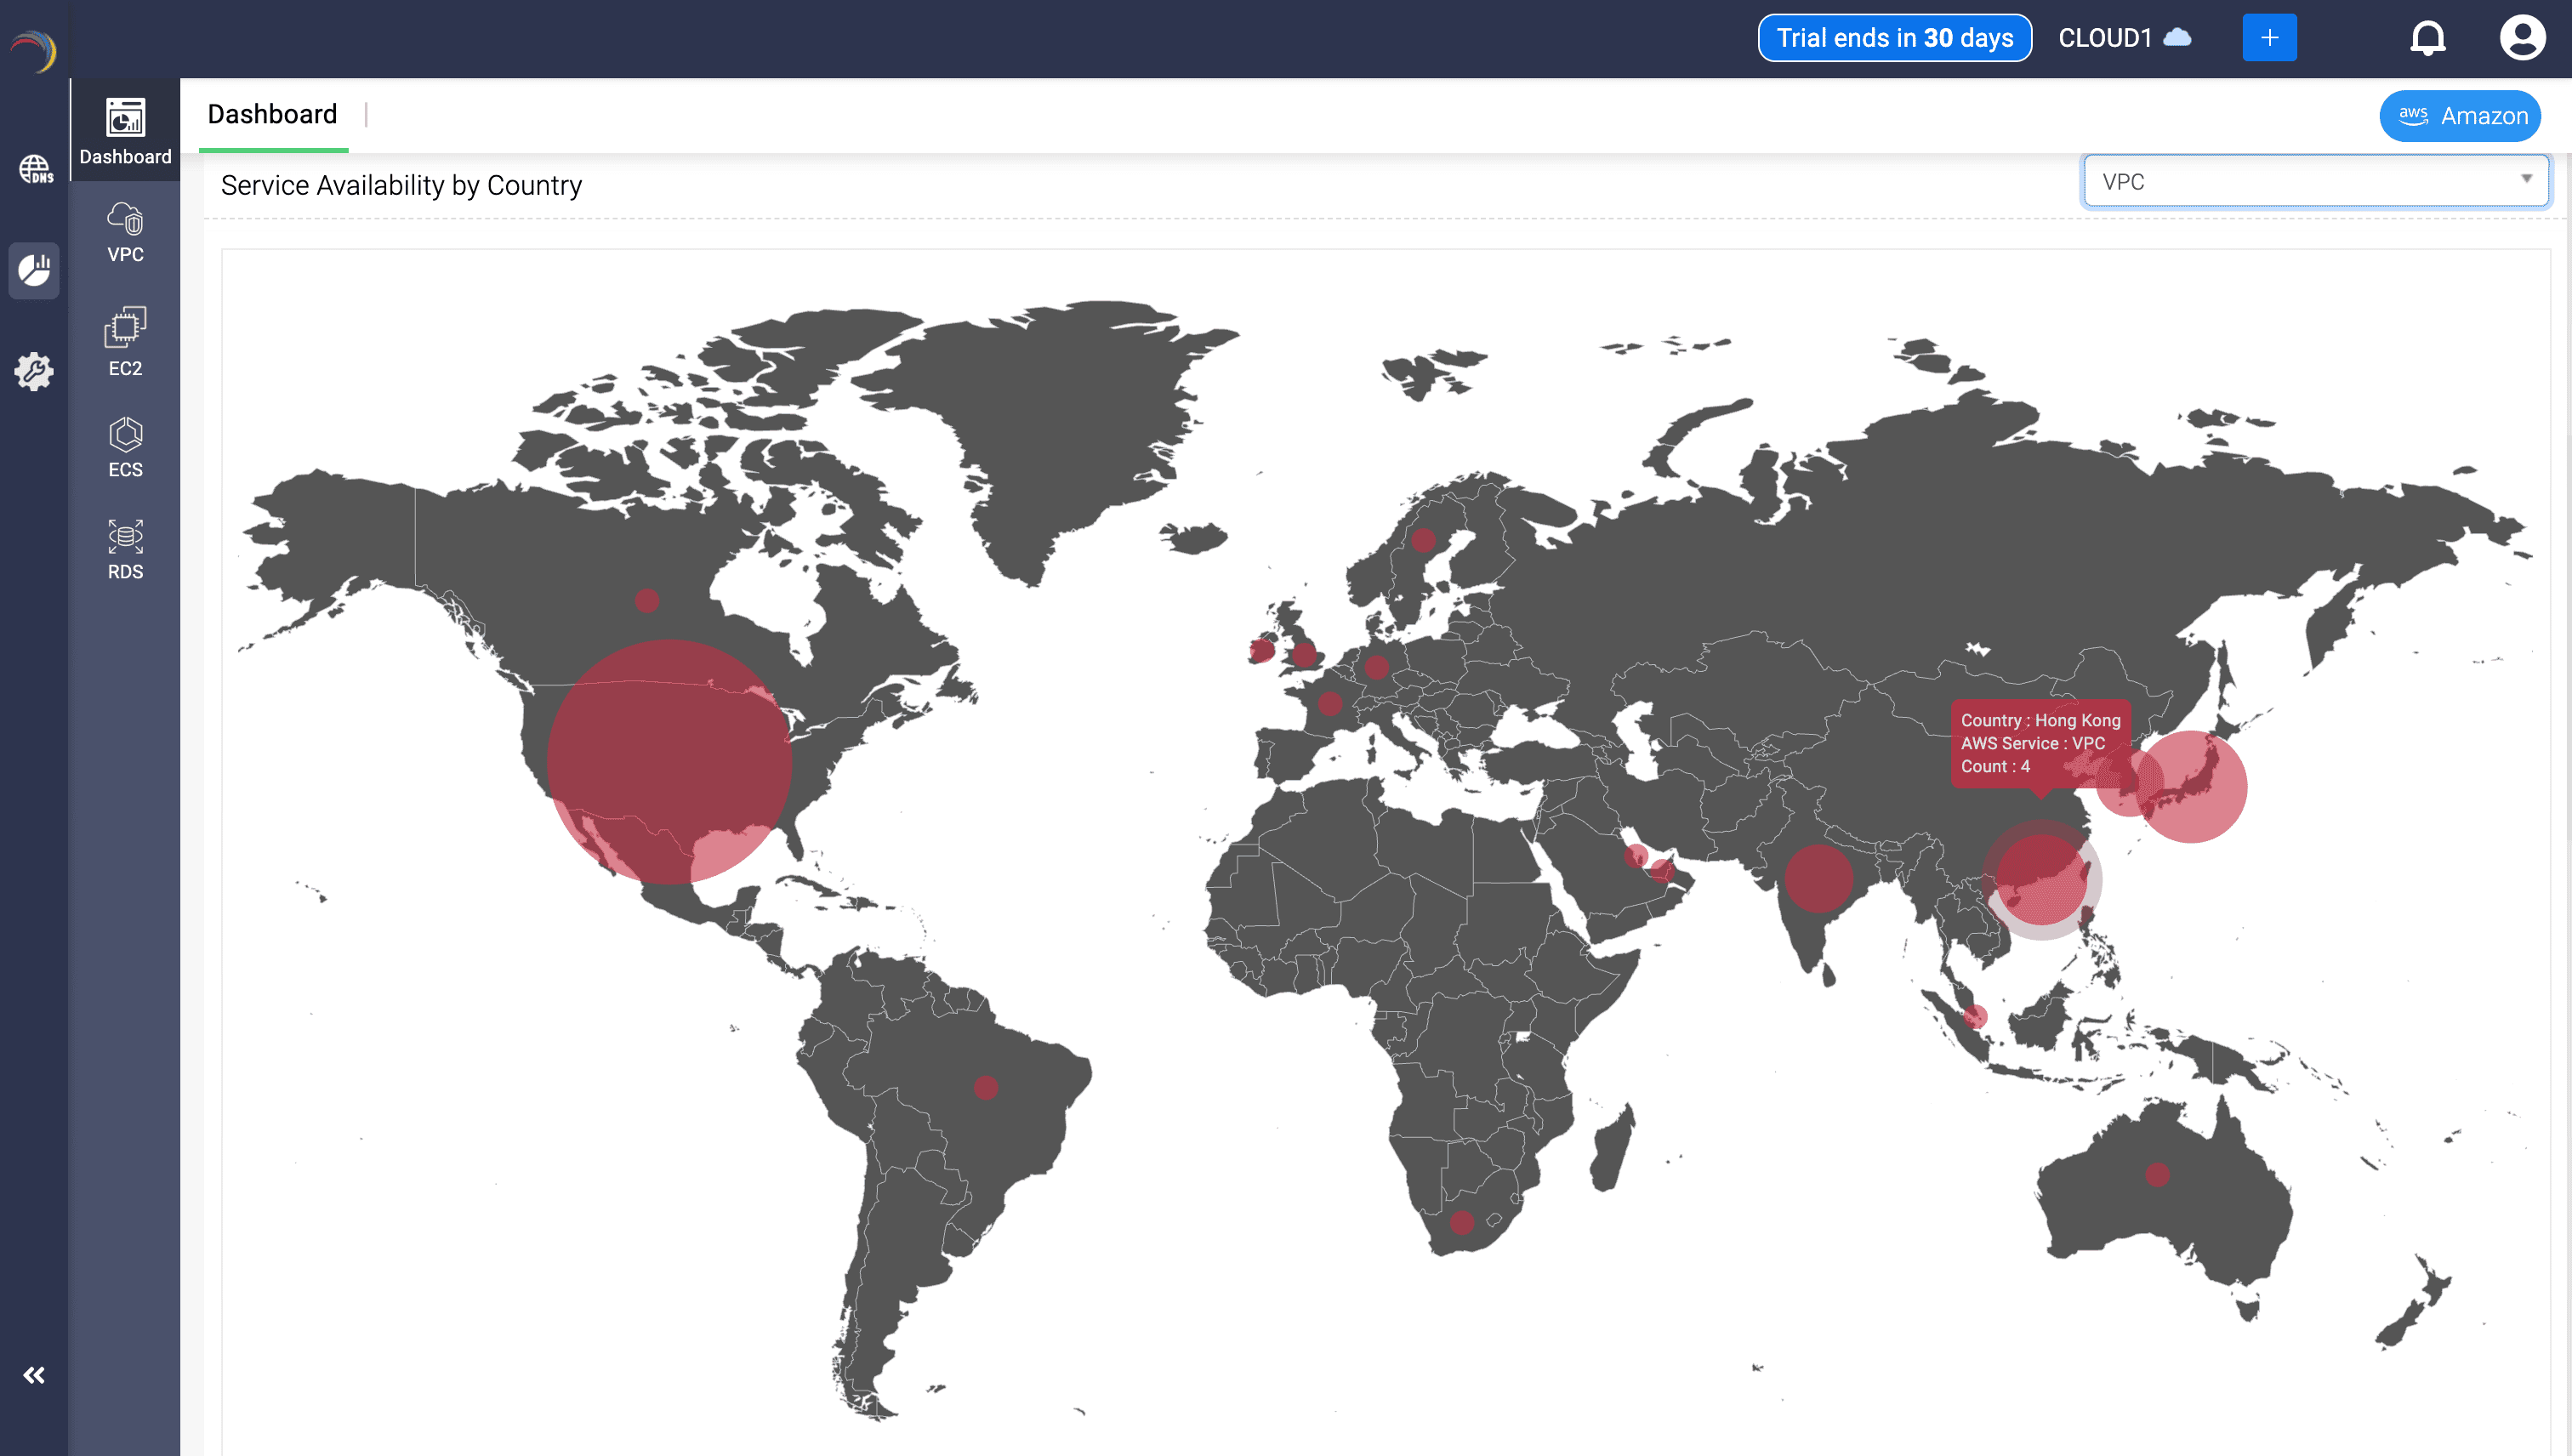
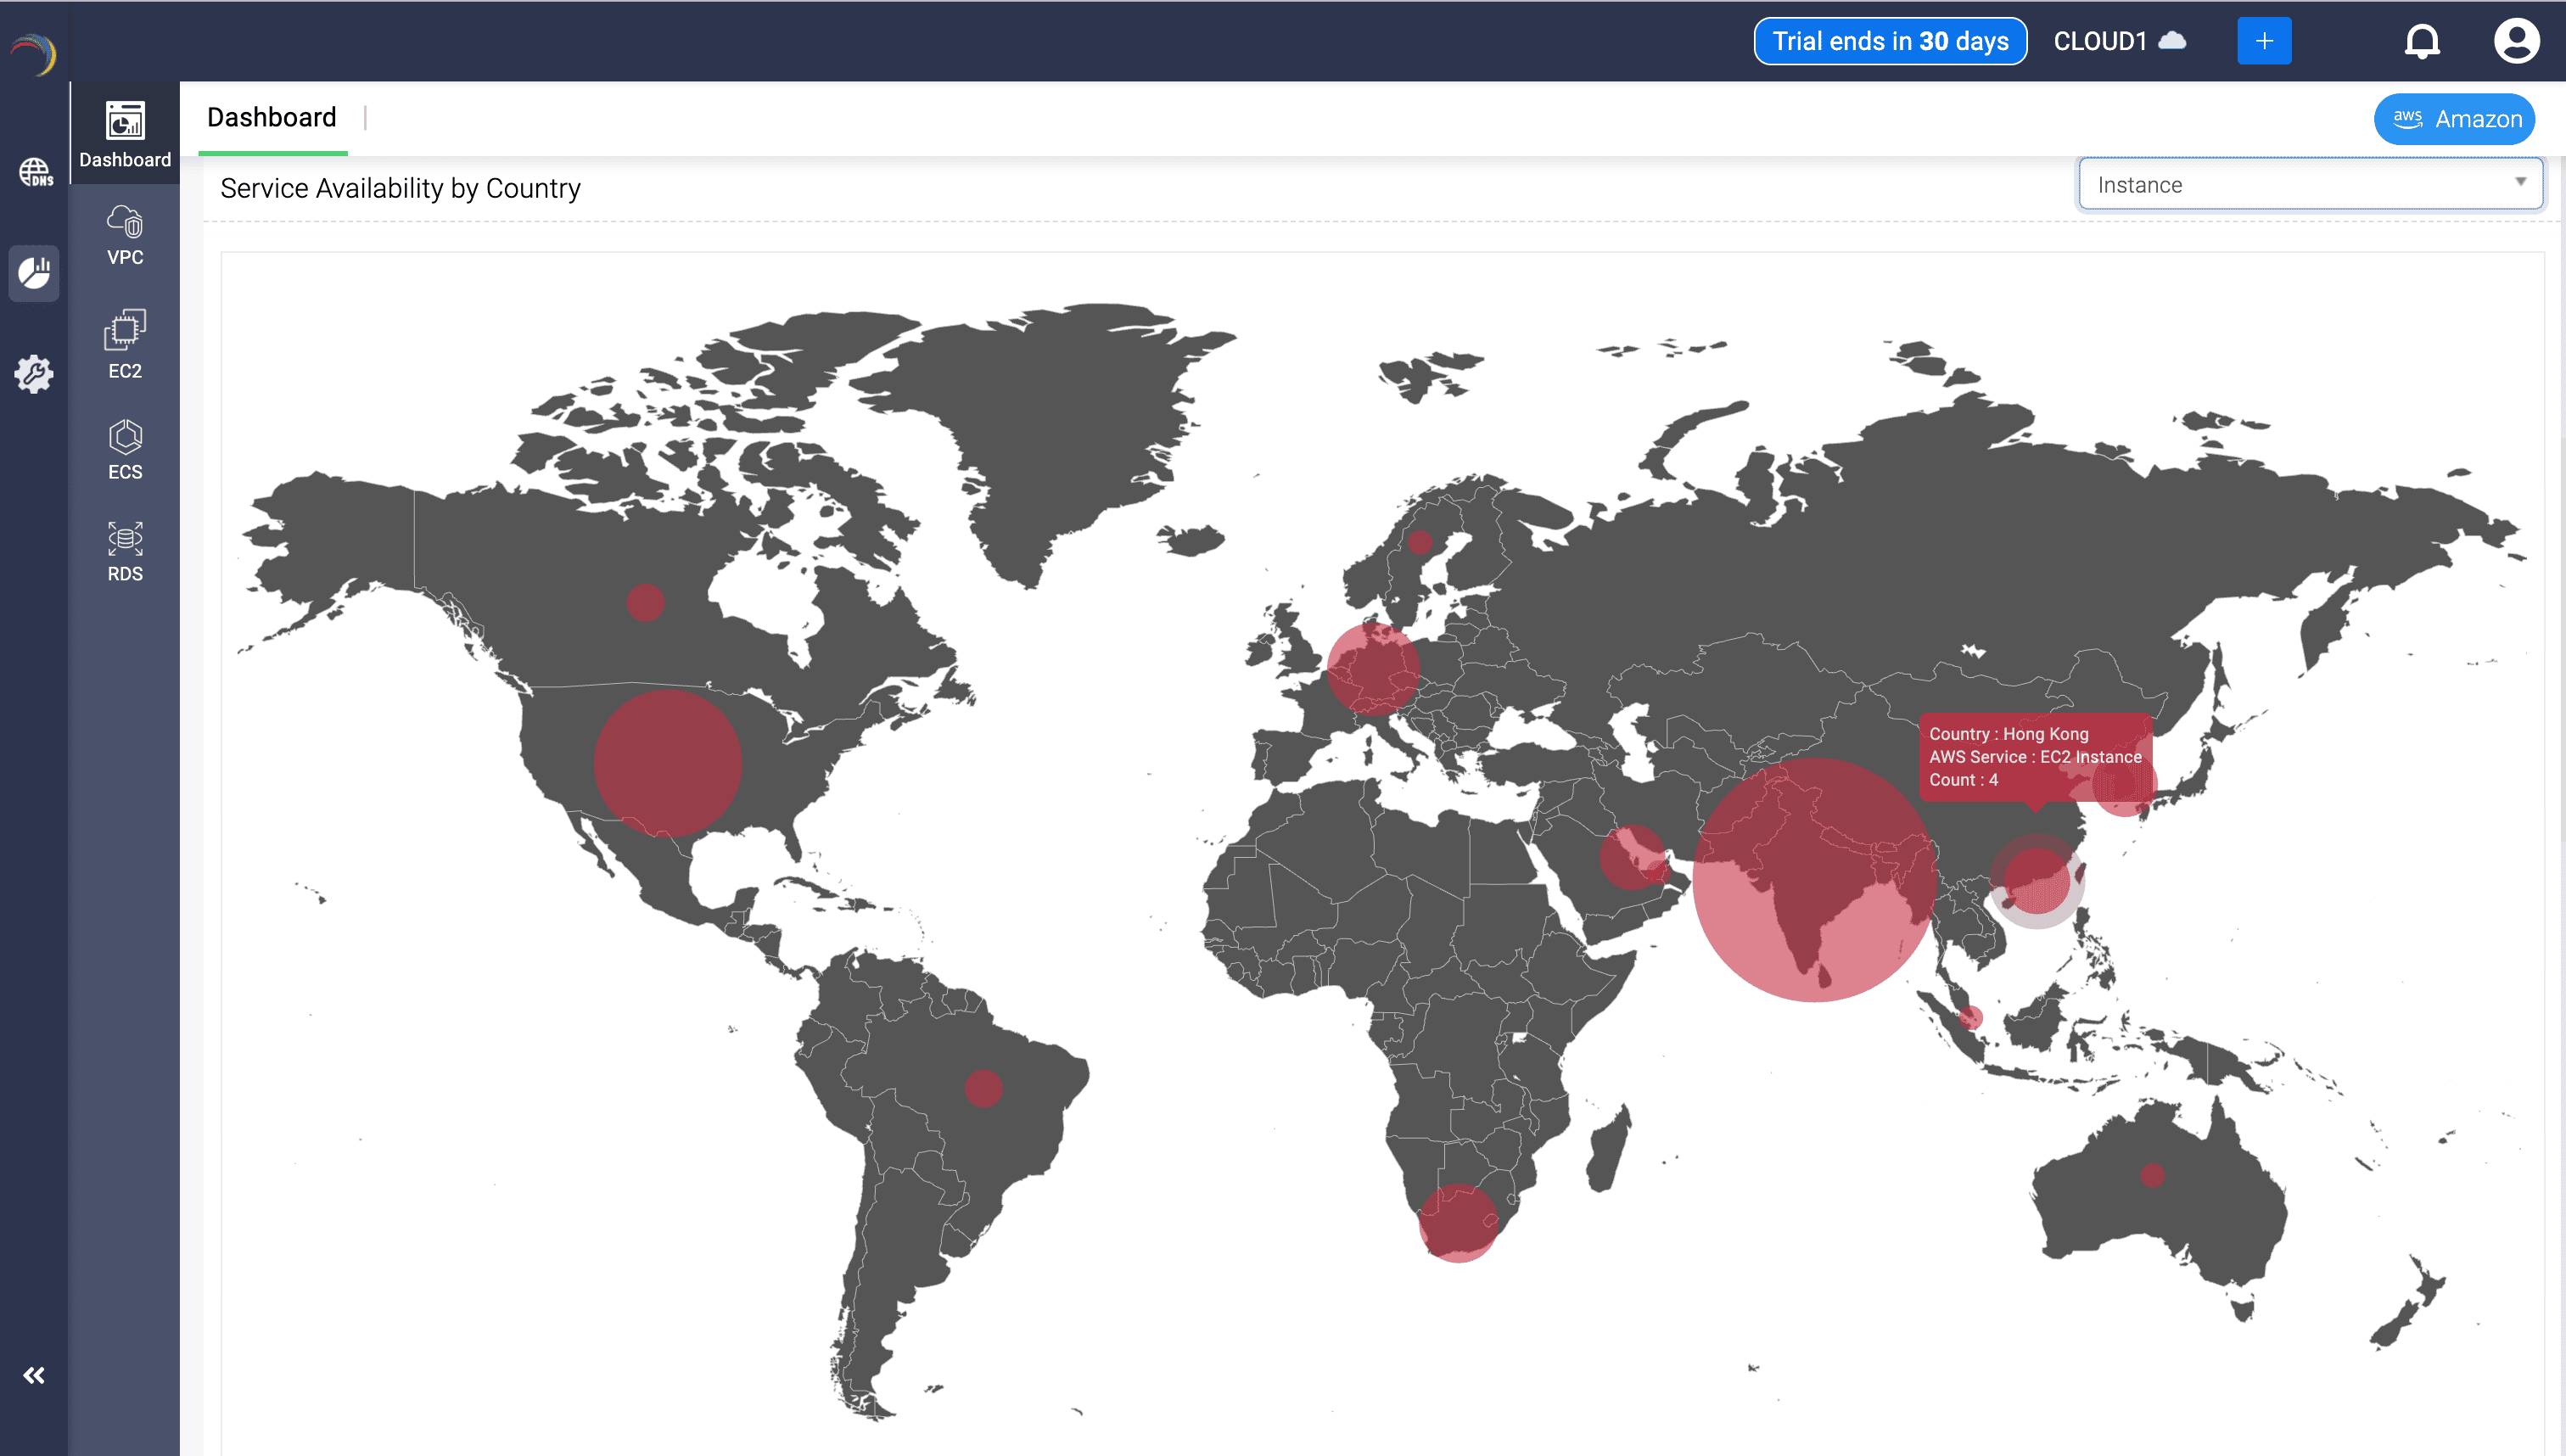
3. Service Availability by Country (World Map View)
- Shows country-wise visualization for selected AWS resource.
- Use the dropdown in the top-right to filter resource type (e.g., Instance, VPC, Subnet).
- Bubble size corresponds to the count. Hover to view region, service type, and resource count.
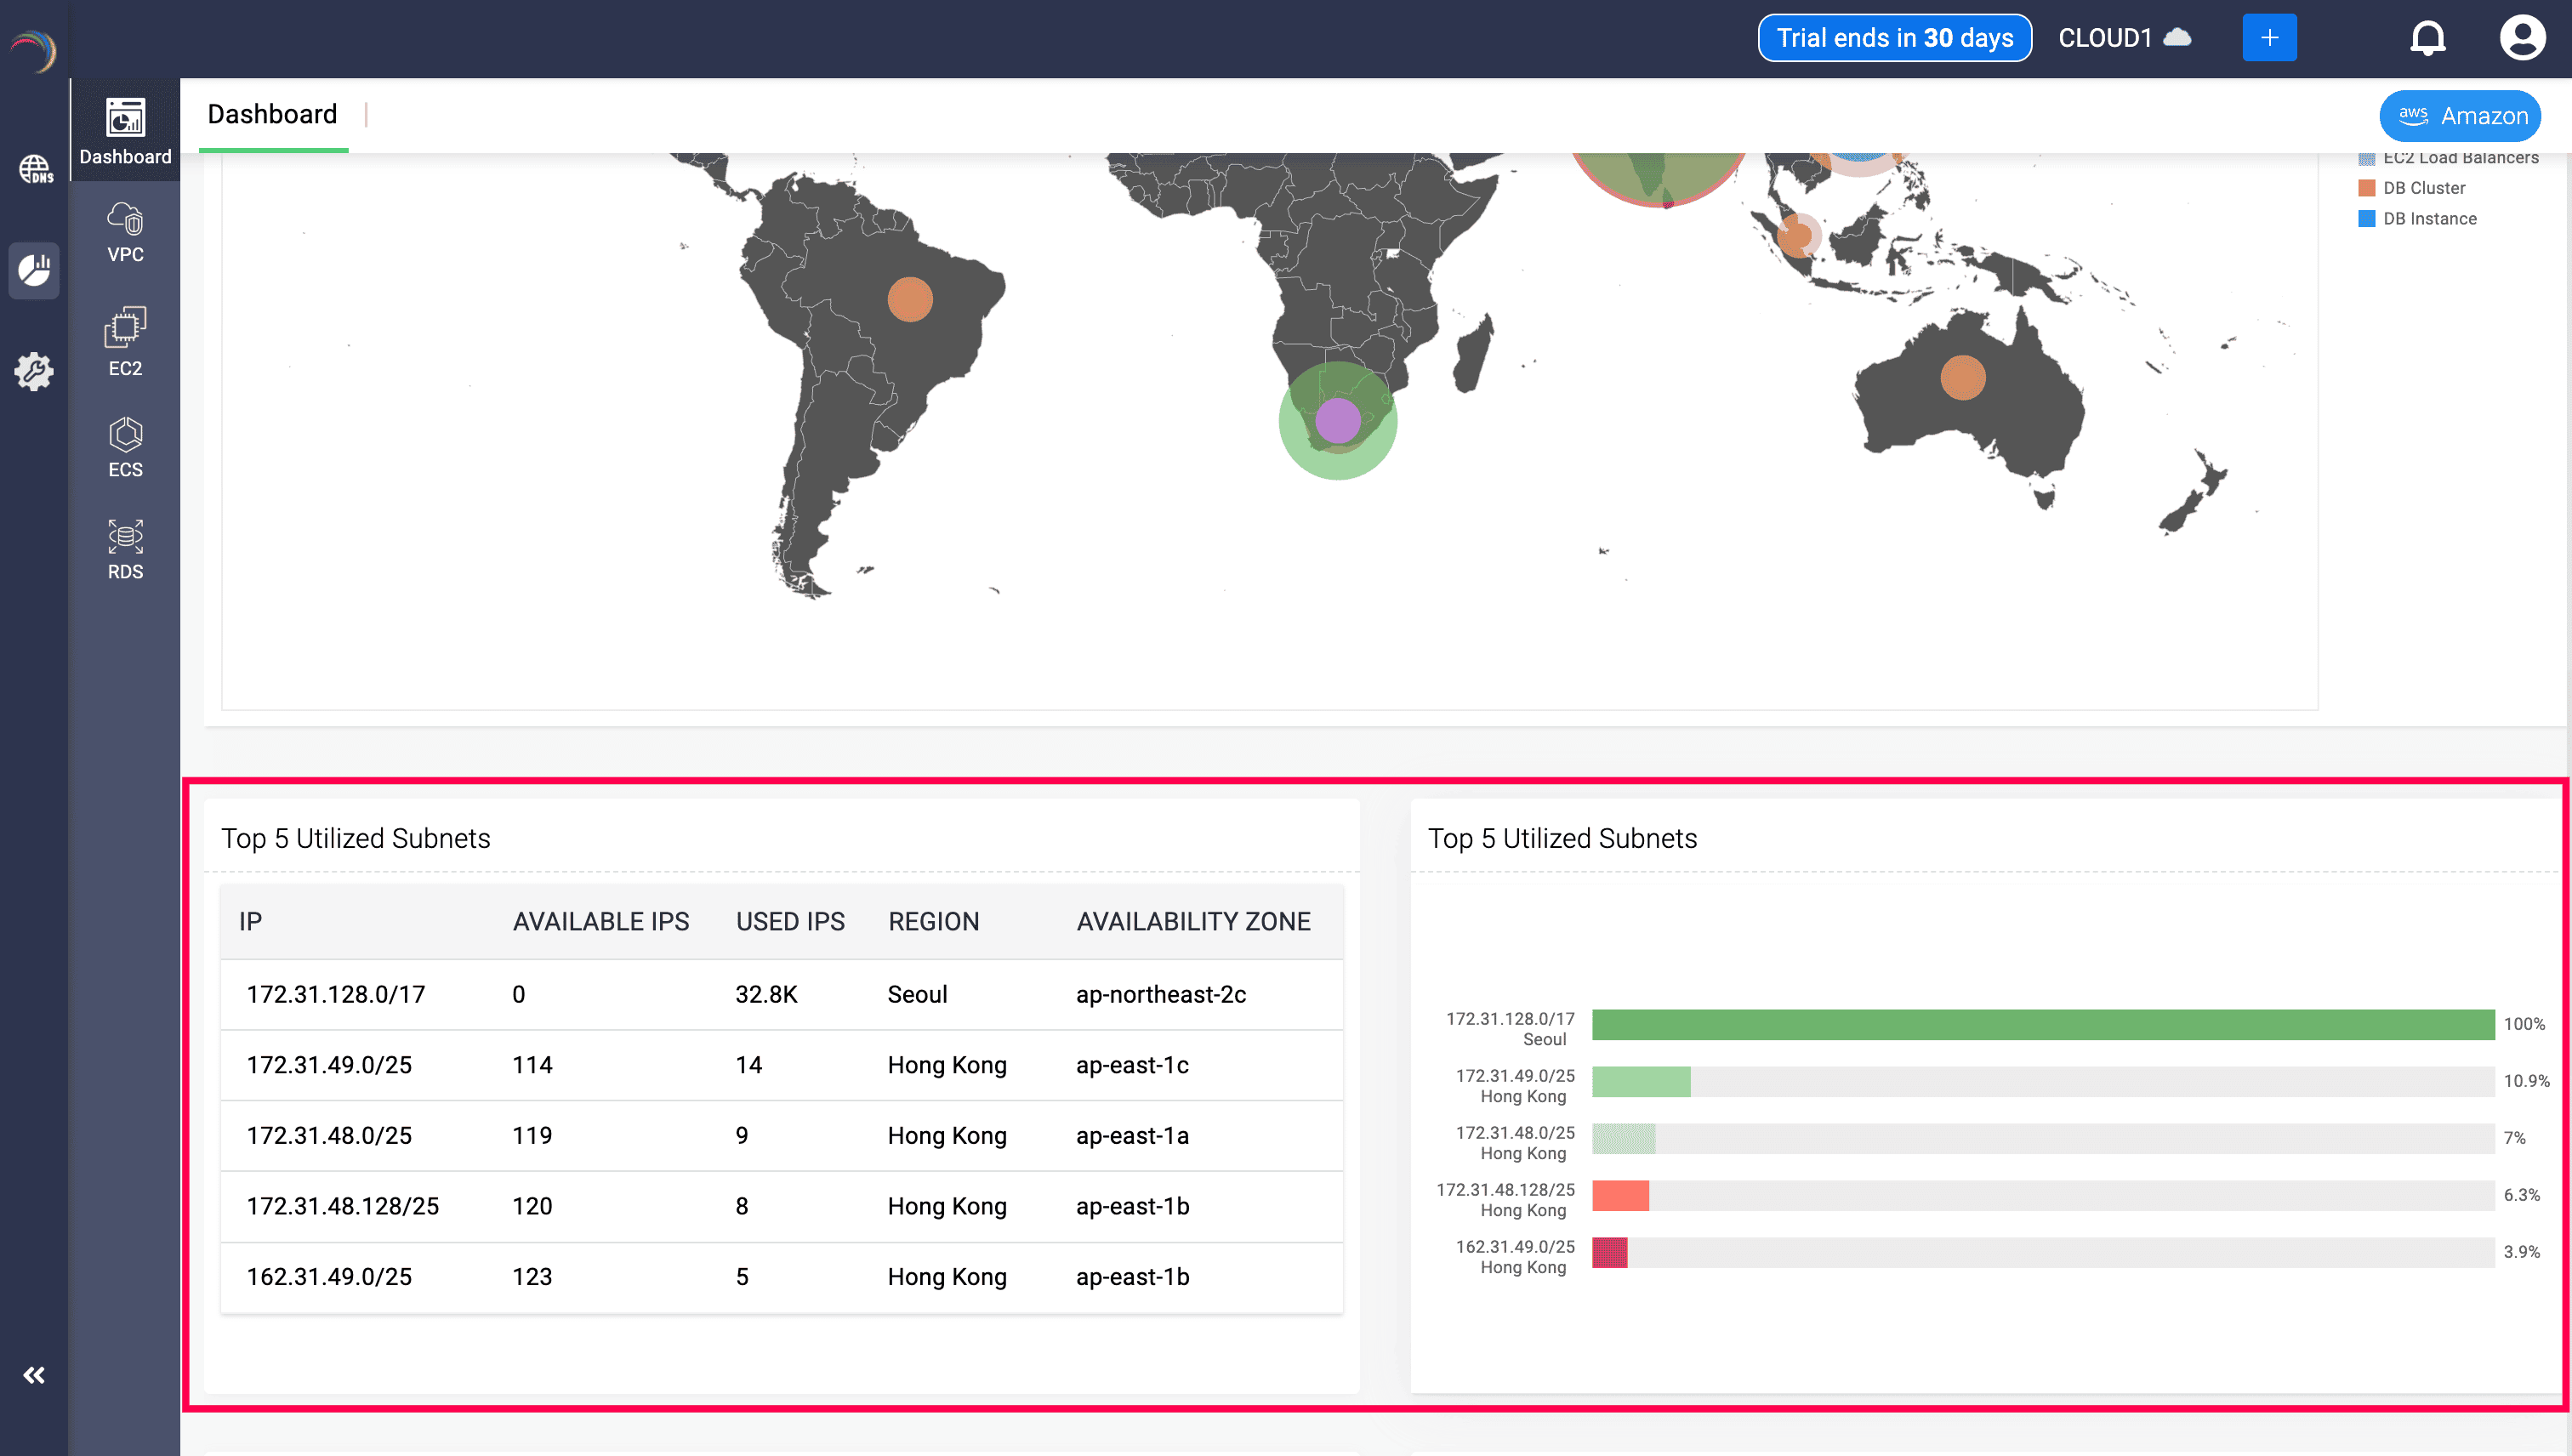
4. Top 5 Utilized Subnets
- Located immediately below the world map.
- The Left table lists the top 5 most utilized Subnets along with each of their: Subnet IP, number of available IPs in the subnet, number of used IPs in the subnet, associated AWS region, and zone.
- Right chart visually ranks top utilized subnets by usage percentage.
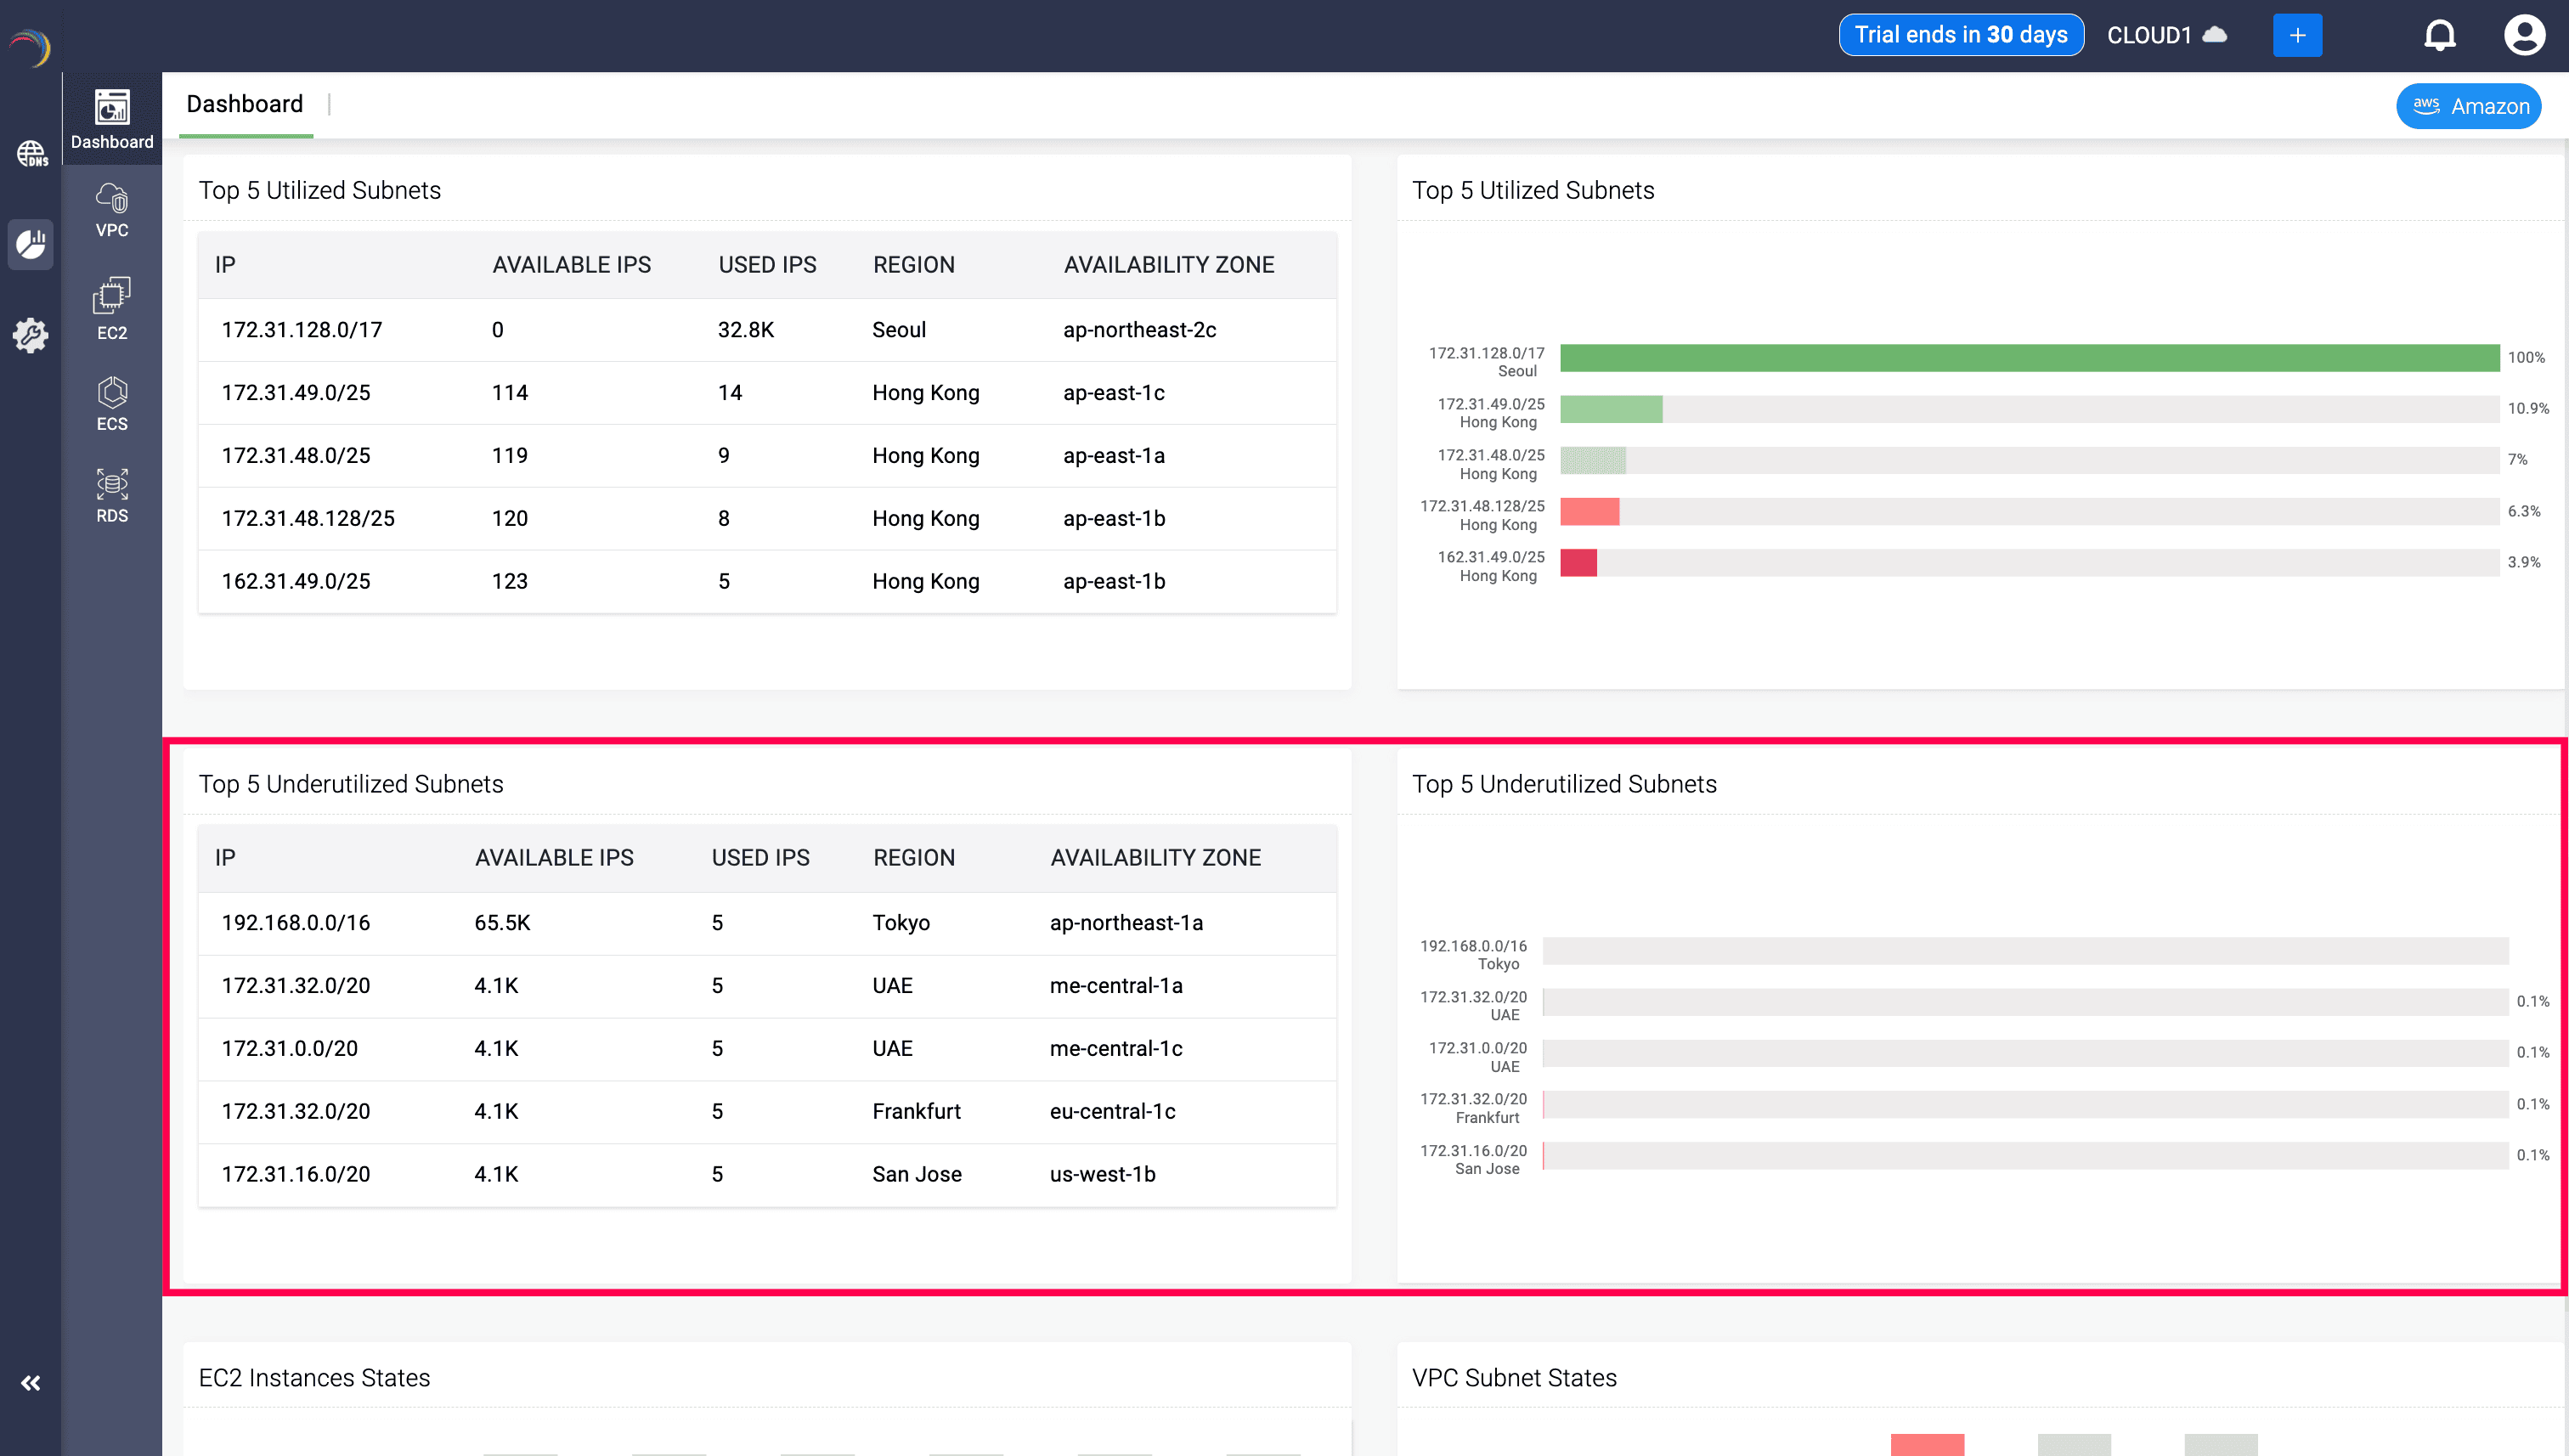
5. Top 5 Underutilized Subnets
- Same as above, but highlights underutilized subnets.
- Ideal for identifying unused IPs or optimizing subnet allocations.
6. EC2 Instance States
- Bar chart showing breakdown of EC2 states:
- Running: Instance is live and currently in use.
- Stopped: Instance is not running and not incurring charges (except for storage).
- Pending: Instance is in the process of booting up.
- Stopping: Instance is shutting down.
- Helps admins track resource status in real-time and optimize usage.
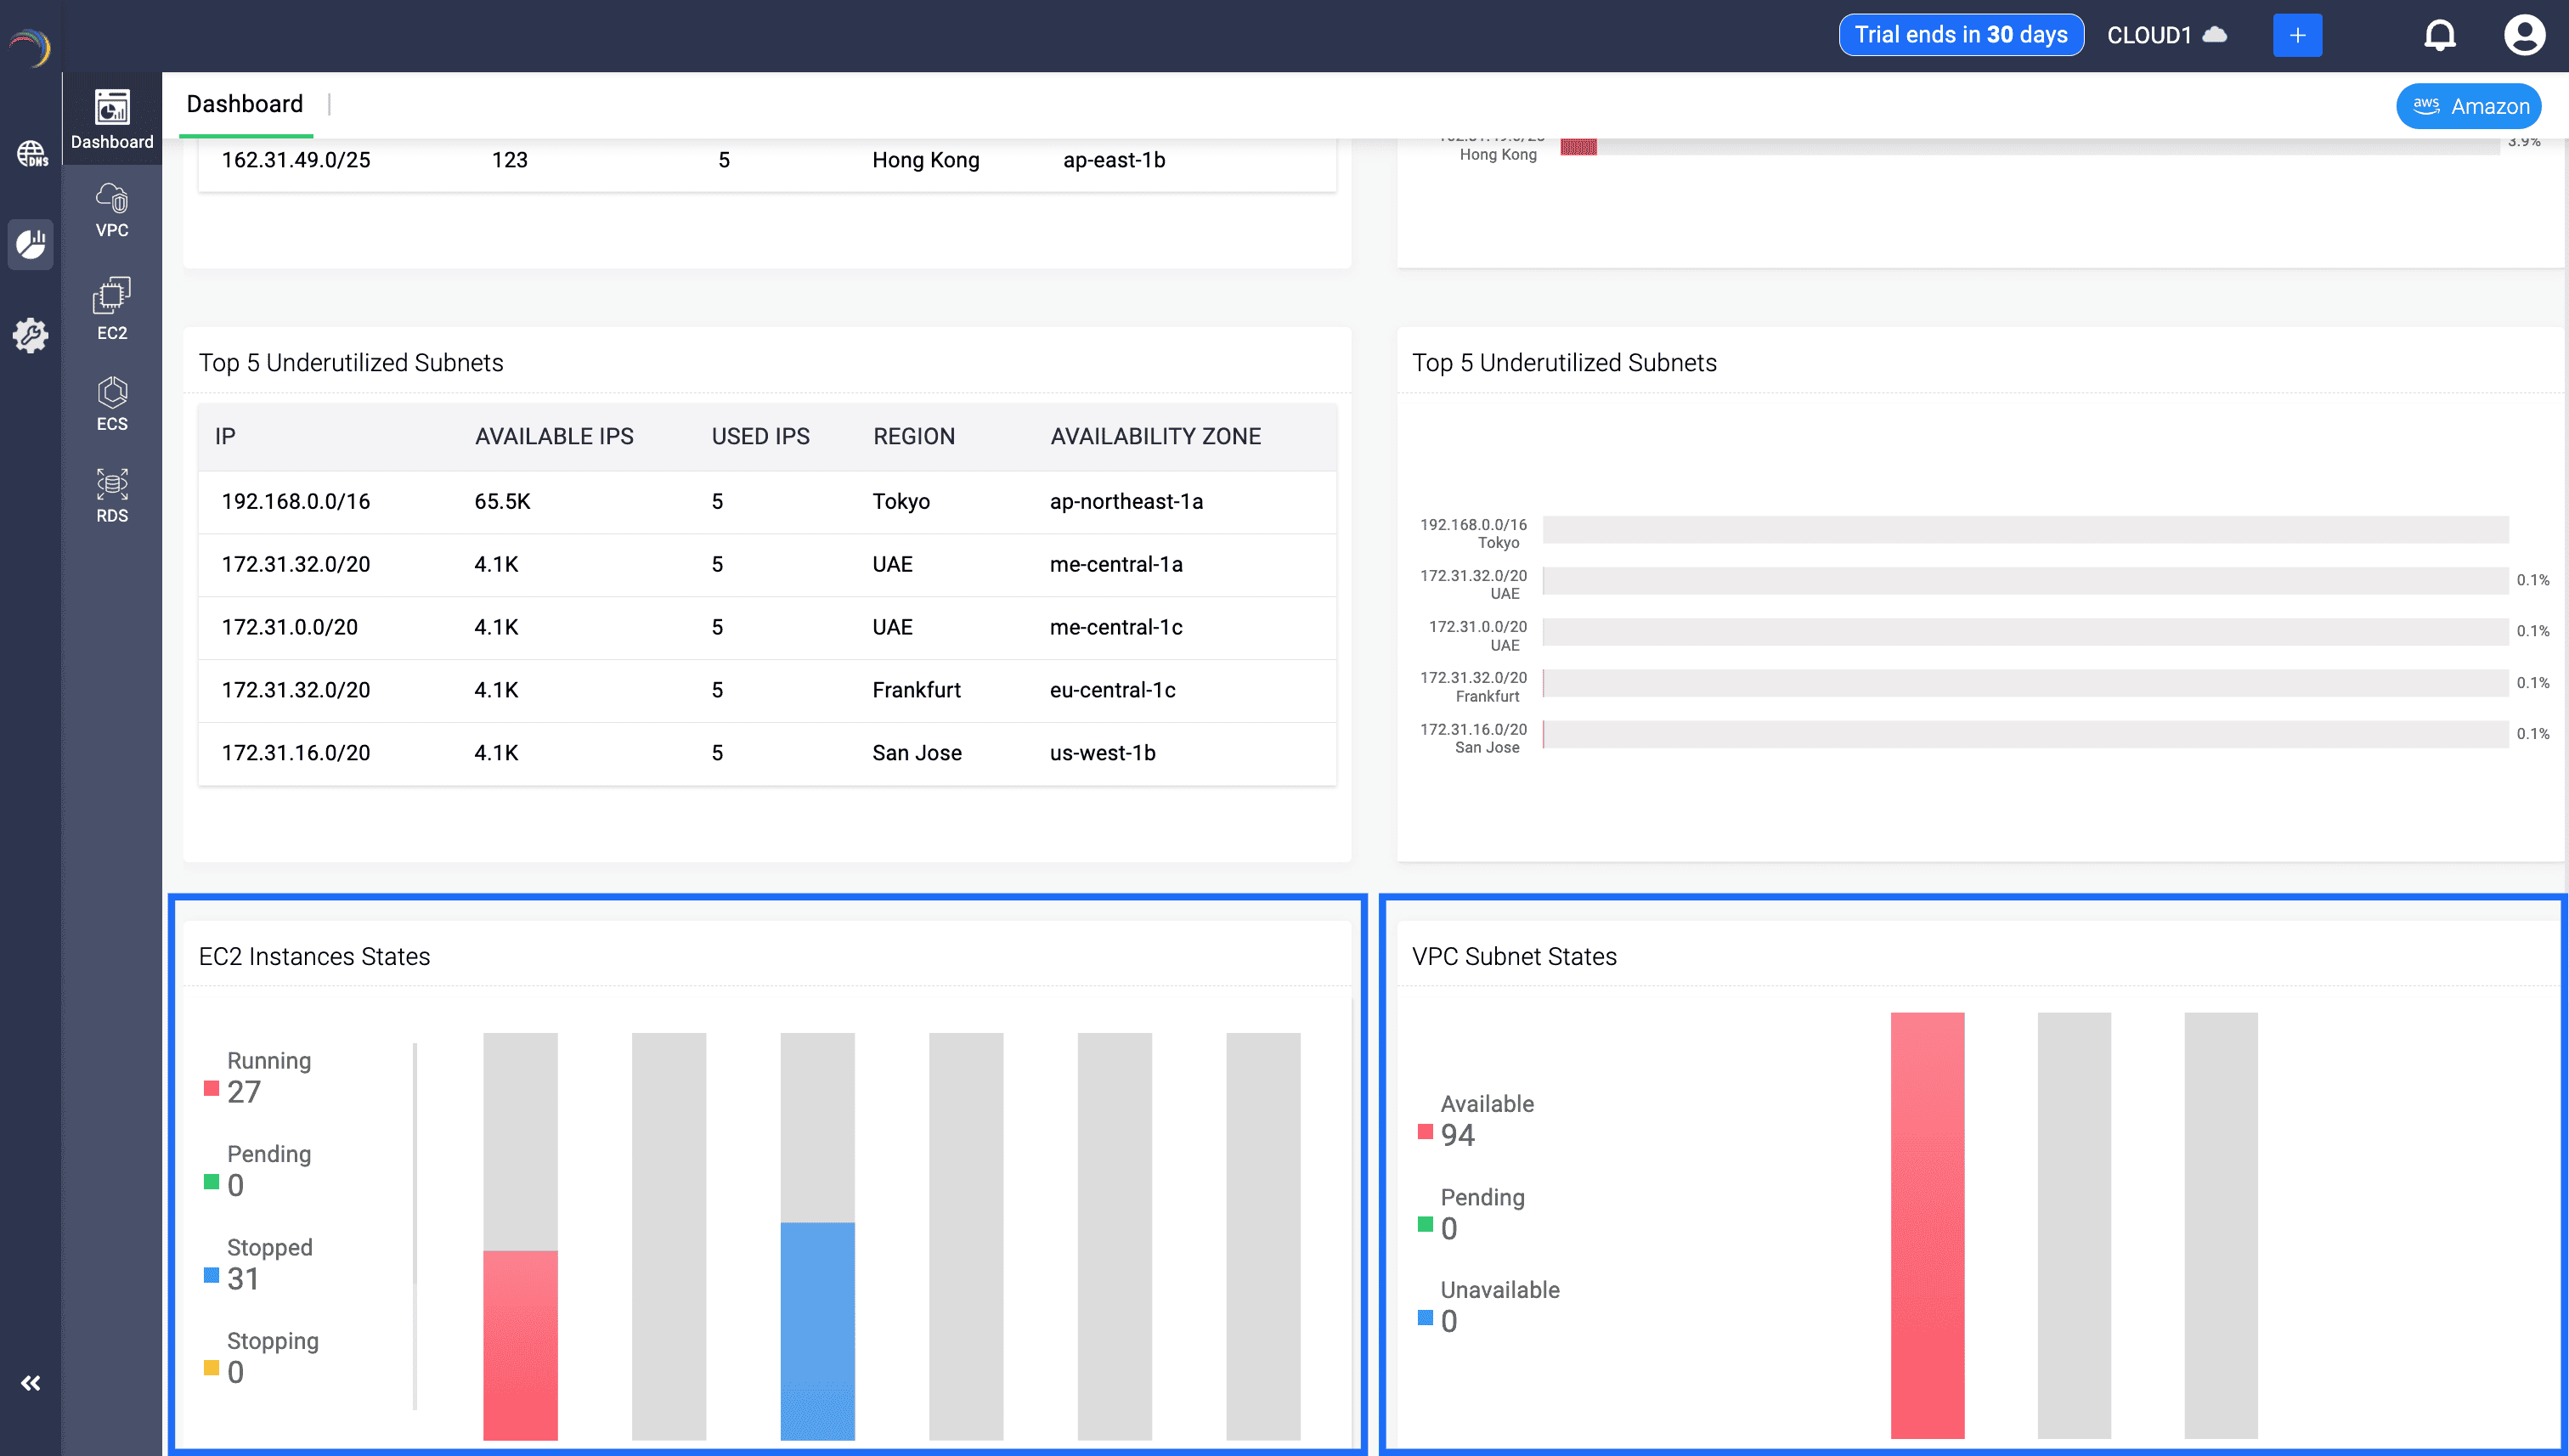
7. VPC Subnet States
- As shown in the image above, this section displays how many subnets are in the following states:
- Available: Subnets are provisioned and ready for use.
- Pending: Subnets are being initialized or modified.
- Unavailable: Subnets are not accessible due to errors or configuration issues.
This dashboard empowers teams to monitor their distributed AWS network assets within a single view.
Use the filters and charts to pinpoint issues, resource gaps, or overprovisioned regions for better cloud planning and cost control.

New to ADSelfService Plus?
Related Articles
AWS RDS Instance Observability in DDI Central
AWS RDS Instance Observability in DDI Central Amazon RDS (Relational Database Service) is a managed database platform that simplifies the deployment and scaling of databases like MySQL, PostgreSQL, SQL Server, and more. It abstracts infrastructure ...DDI Central system settings
DDI Central System settings DDI Central provides customizable time configurations for both DNS and DHCP services, which lets administrators can set their own time period, based on their system configurations. This helps admins automate network tasks ...Analyzing AWS EC2 Network Resources in DDI Central
Analyzing AWS EC2 Network Resources in DDI Central Amazon EC2 (Elastic Compute Cloud) is at the heart of most AWS deployments, powering scalable virtual machines for applications, services, and infrastructure workloads. But managing EC2 efficiently ...Analyzing AWS VPCs and VPC Subnets in DDI Central
Analyzing AWS VPCs and VPC Subnets in DDI Central Table of Contents Analyzing AWS VPC VPC: Subnets VPC: Instances VPC: Network Interfaces VPC: Load Balanceers VPC: DB Instances Analyzing AWS Subnets within VPCs VPC Subnets: VPC VPC Subnets: Instances ...50. Multi vendor dns integration with DDI Central for Linux
Multi-vendor DNS integration with DDI Central DDI Central serves as a powerful tool for organizations managing multiple domains across various hosted DNS providers. By centralizing DNS management, DDI Central becomes the single point of management ...