How to increase the number of records displayed in EventLog Analyzer's Reports and Search modules
Objective
By default, EventLog Analyzer displays a limited number of records (default: 10 records) in the UI for both the Reports and Search modules. However, administrators may need to increase this limit to view more log entries directly within the console. This document explains how to increase the number of records displayed per page in the UI.
Prerequisite
- Access to the EventLog Analyzer console with administrative privileges.
Steps to follow
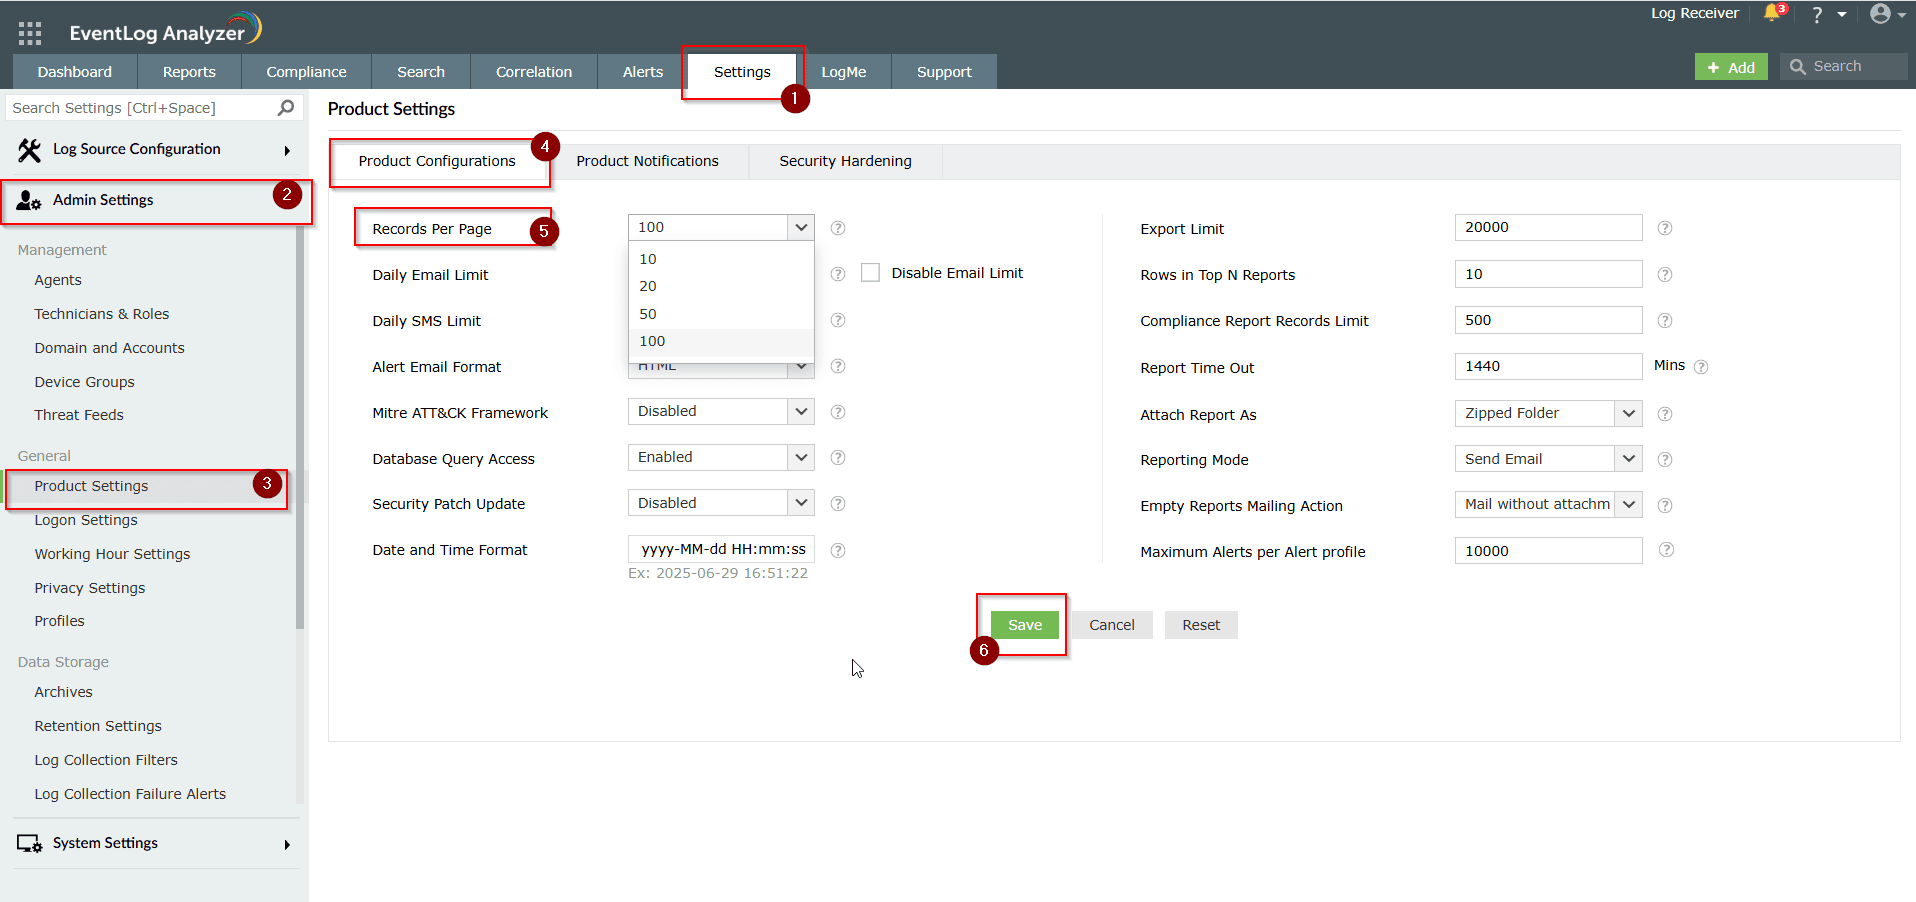
Step 1: Navigate to Settings > Admin Settings > Product Settings > Product Configuration.
Step 2: Locate the Records per page field.
Step 3: From the dropdown, select the number of records to display per page. The available options are 10, 20, 50, or 100.
Step 4: Click Save to apply the changes.
Tips
- Increasing the number of records displayed per page can impact UI responsiveness, especially if your environment has high events per second (EPS) or limited system resources.Start with moderate values (e.g., 25 or 50), validate UI responsiveness, and adjust accordingly.
- Avoid setting the value to the maximum (e.g., 100) on systems with low RAM or CPU.
Related articles and topics

New to ADSelfService Plus?
Related Articles
How to increase the records per page in Eventlog Analyzer
Objective By default, EventLog Analyzer displays 10 records per page in the Reports section. While users can manually adjust this number, the change is temporary. This article will guide you through configuring a global rule so that all reports ...Troubleshooting guide: EventLog Analyzer UI is unresponsive
Overview This document outlines the common causes and recommended steps to resolve the issue when the EventLog Analyzer UI becomes unresponsive. Possible causes Insufficient system resources High CPU or memory usage on the server. Low disk space in ...How to reduce the number of cached records in EventLog Analyzer
Issue description Cached record files are unprocessed log files that can accumulate within the EventLog Analyzer local directory when the indexing process is disrupted. When the number of cached record files exceeds 100, an email notification will be ...Introduction to EventLog Analyzer
What is log management? An enterprise network consists of different entities—perimeter devices, workstations, servers, applications, and more. Each entity records every activity that unfolds within it in the form of logs. These logs hold information ...Disk Space Alert: EventLog Analyzer Installation Drive Reaching Capacity Threshold
Issue description This document provides a technical overview, possible causes, recommended resolution steps, and best practices for handling the "Disk Space Alert: EventLog Analyzer Installation Drive Reaching Capacity Threshold" notification. This ...