Troubleshooting guide: EventLog Analyzer UI is unresponsive
Overview
This document outlines the common causes and recommended steps to resolve the issue when the EventLog Analyzer UI becomes unresponsive.
Possible causes
- Insufficient system resources
- High CPU or memory usage on the server.
- Low disk space in installation or log directories.
- Corrupted or overloaded database
- Elasticsearch issues due to network or port connectivity disruptions.
- Large volume of raw log data or reports that slow down queries.
- Background tasks overload
- Log parsing, report generation, or alerting tasks consume excessive resources.
- High-frequency scheduler tasks.
- Corrupted UI files or services not running
- Web server is not initialized properly.
- Corrupted web UI or Java components.
- Log rotation or archival issues
- Large volume of unarchived or uncompressed logs can slow down the UI.
- File system errors on log directories.
- Cached records
- The unprocessed logs might be piled up in the server due to system resource crunch, and the product will take some time to process it in the backend.
Prerequisites
- Ensure that the EventLog Analyzer server is allocated with appropriate system resources based on the log flow in your instance. Refer to the following guide to get a better perspective: System requirements
- Verify that the mandatory ports are opened/enabled in the EventLog Analyzer installed server using the following guide: Prerequisites
- If the antivirus or endpoint protection software is running on the EventLog Analyzer installed server, validate that you have excluded the <dir> ManageEngine\EventLog Analyzer directory path from the solution's scan list.
- Ensure that the EventLog Analyzer installed server's memory is reserved and locked in 100%. Reference: System requirements
Resolution
Step 1: CPU and memory consumption
- Stop any unnecessary background processes running on the EventLog Analyzer server to reclaim system resources. Aim to align the system’s resource usage with the recommended values outlined in the prerequisite guide above.
Step 2: Port and network connectivity check
- On some cases, a GPO push might revert the already opened ports and protocol in the EventLog Analyzer installed server. Hence, ensure that the Elasticsearch ports are opened/enabled in the firewall rules as per the following guide: Prerequisites
Step 3: Memory reservation
- CPU and memory allocation
- Allocate 100% of the available RAM and CPU to the VM running EventLog Analyzer.
- Avoid resource sharing with other VM on the same host, as it may lead to CPU and RAM starvation, which can severely impact performance.
- Storage provisioning
- Use thick provisioning for virtual disks.
- For VMware environments, select Thick Provision Eager Zeroed for optimal performance.
- Avoid Thick Provision Lazy Zeroed as it delivers lower performance, and thin provisioning altogether, as it increases I/O latency.
- Snapshot management
- Disable or avoid using VM snapshots during regular operations.
- Snapshots duplicate data across multiple blocks, increasing read/write operations and causing higher I/O latency, which can degrade system performance.
- CPU and RAM utilization best practices
- Ensure that CPU utilization remains below 85% to maintain consistent and reliable performance.
- Reserve at least 50% of server RAM for off-heap utilization by Elasticsearch, which is crucial for indexing and searching efficiency.
- Disk configuration
- Disk latency is a critical factor for EventLog Analyzer’s performance.
- Use direct-attached storage (DAS) with performance equivalent to SSD—offering near-zero latency and high throughput.
- Enterprise-grade storage area networks (SANs) may also be used if they offer superior performance over standard SSDs.
Step 4: Clear browser cache/Try another browser
- Clear the browser cache or use incognito mode. Try accessing from a different machine/network.
Step 5: Cached records(Unprocessed log files)
- Please note that the files in the CachedRecord folder are logs that have been collected but are yet to be processed. This situation could arise due to high resource usage by Java for processing the data or insufficient hardware resources at the time. Do not delete the files in the CachedRecord folder, as this could lead to data loss. These files will be automatically processed when sufficient resources are available. As long as the files in this folder are eventually processed and the folder doesn't continuously accumulate files, there should be no cause for concern.
- The cached records directory path: <dir>: ManageEngine\EventLog Analyzer\ES\CachedRecords
- If the issue persists, please follow the instructions listed in the memory reservation section.
- EventLog Analyzer also provides email notifications when unprocessed log files accumulate and form cached records. Please refer to this link to know more.
Step 6: Increasing product memory
- Follow these steps to increase the memory allocated to EventLog Analyzer.
Go to EventLog Analyzer folder → open file titled "server\conf\wrapper.conf"
You can increase the memory allocated by editing the default values of initmemory and maxmemory as shown below.
# Initial Java Heap Size (in MB)
wrapper.java.initmemory=1024
#Maximum Java Heap Size (in MB)
wrapper.java.maxmemory=1024
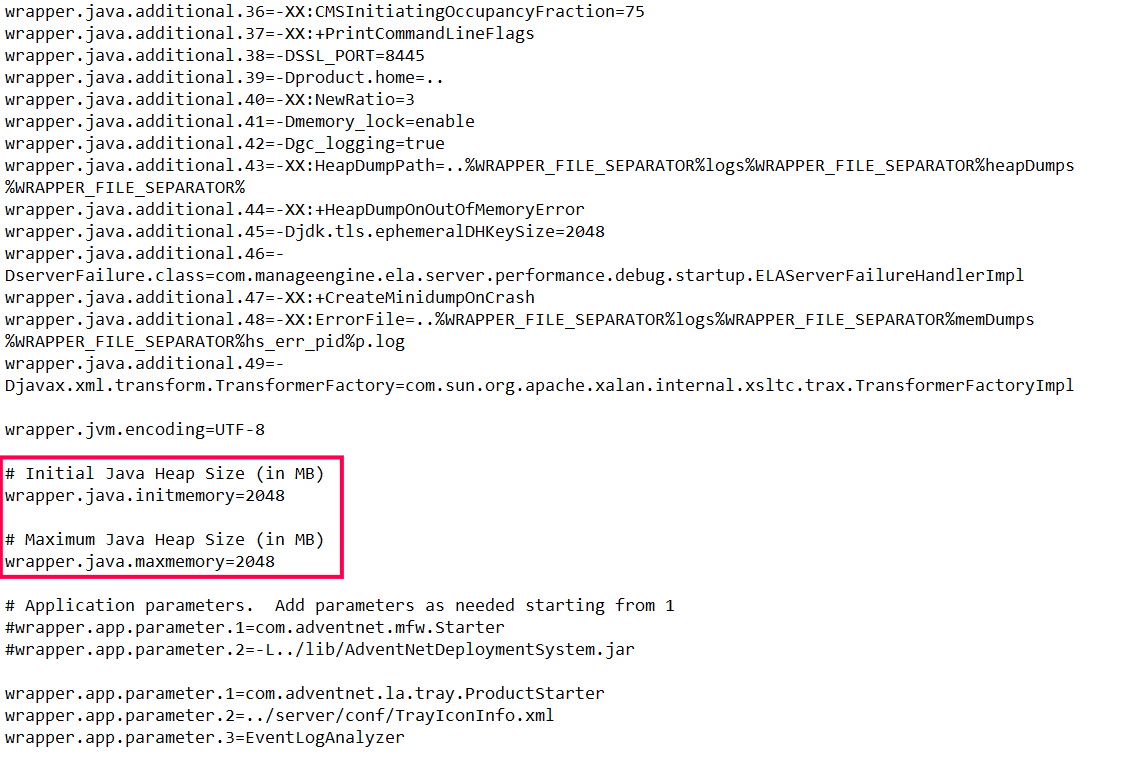
- You can Increase the Product Memory upto 6GB Maximum
- Restart the product after memory allocation. The changes will be effective only after the product is restarted.
Tips
- Set your log retention days exactly based on your requirements. Reference: Retention settings || Archive
- Upgrade to the latest builds of EventLog Analyzer. Reference: Upgrade to latest version of EventLog Analyzer build || Eventlog Analyzer latest features
- Schedule periodic server restarts during off-hours.
How to contact support
If the issue persists, please share the following with ManageEngine support by contacting us through any of the following methods:
- Zipped logs folder - <dir>: ManageEngine\Eventlog Analyzer\logs
- All relevant screenshots or recording of the issue.
- Current system specifications screenshot (RAM, CPU, OS)
- Current build number. You can find the build number in the following file: <dir>: ManageEngine\EventLog Analyzer\conf\product.conf
Support Channels:
Toll-Free (US): +1 844 649 7766
Live Chat: EventLog Analyzer live chat support
Related articles and topics

New to ADSelfService Plus?
Related Articles
Troubleshooting: Unable to Access EventLog Analyzer User Interface
Issue description You may not be able to access EventLog Analyzer user interface or web console in your browser or over multiple machines thou EventLog Analyzer is running as service/console mode. This article offers possible cause and step by step ...Unable to start EventLog Analyzer
Issue description This issue occurs when the EventLog Analyzer service fails to start, or when users are unable to access the web client through the browser (typically on ports 8400 or 8445). Users may experience one or more of the following ...How to uninstall EventLog Analyzer Windows agent via UI
Objective This article provides detailed information on how to uninstall a Windows agent from the user interface of EventLog Analyzer. Prerequisites Ensure the required network ports are open: Port 135 Port 139 Port 445 Dynamic RPC port range ...Troubleshooting: Disk space issues in EventLog Analyzer
Issue description EventLog Analyzer server might run out of storage due to misconfiguration and other known factors. This article offers troubleshooting steps to resolve when your disk or drive where the application is installed is full and help you ...Windows agent not communicating with EventLog Analyzer server
Issue description When the agent fails to communicate with the EventLog Analyzer server, the log transfer between devices is disrupted. As a result, logs accumulate on the agent machine until connectivity is restored. This delay in log transmission ...