Error: Alerts are not getting triggered in EventLog Analyzer
Issue description
Alerts are not recorded in EventLog Analyzer. This problem occurs due to various reasons and impacts detections. This document offers troubleshooting information to resolve this issue.
Possible causes
- The alert profile may be disabled.
- Events related to alerts are not recorded natively.
- Events related to alert are not collected by the application.
- The daily alert limit has been reached for the respective alert profile.
- Alert dumps may be getting stored due to processing delays or latency in the system.
Resolution
Step 1: Verify the alert profile is enabled
- Navigate to the Alerts tab > Select Manage Profiles.
- Ensure the relevant alert profile is enabled.
Step 2: Check if the alert profile is configured to have the alerts recorded
- Navigate to the Alerts tab > click More Tools > select Manage Profiles and edit the respective alert profile.
- Click the + symbol next to Criteria to view the criteria set for the alert profile.
- Verify if the criteria set matches your requirements.
Step 3: Check if the respective event is collected in the application
Navigate to the Search tab and use the same criteria to view if the event is collected by the application. There are two possible outcomes in this scenario.
Navigate to the Search tab and use the same criteria to view if the event is collected by the application. There are two possible outcomes in this scenario.
- The event is available in the Search tab but does not meet the criteria used
- The event is not available in the Search tab.
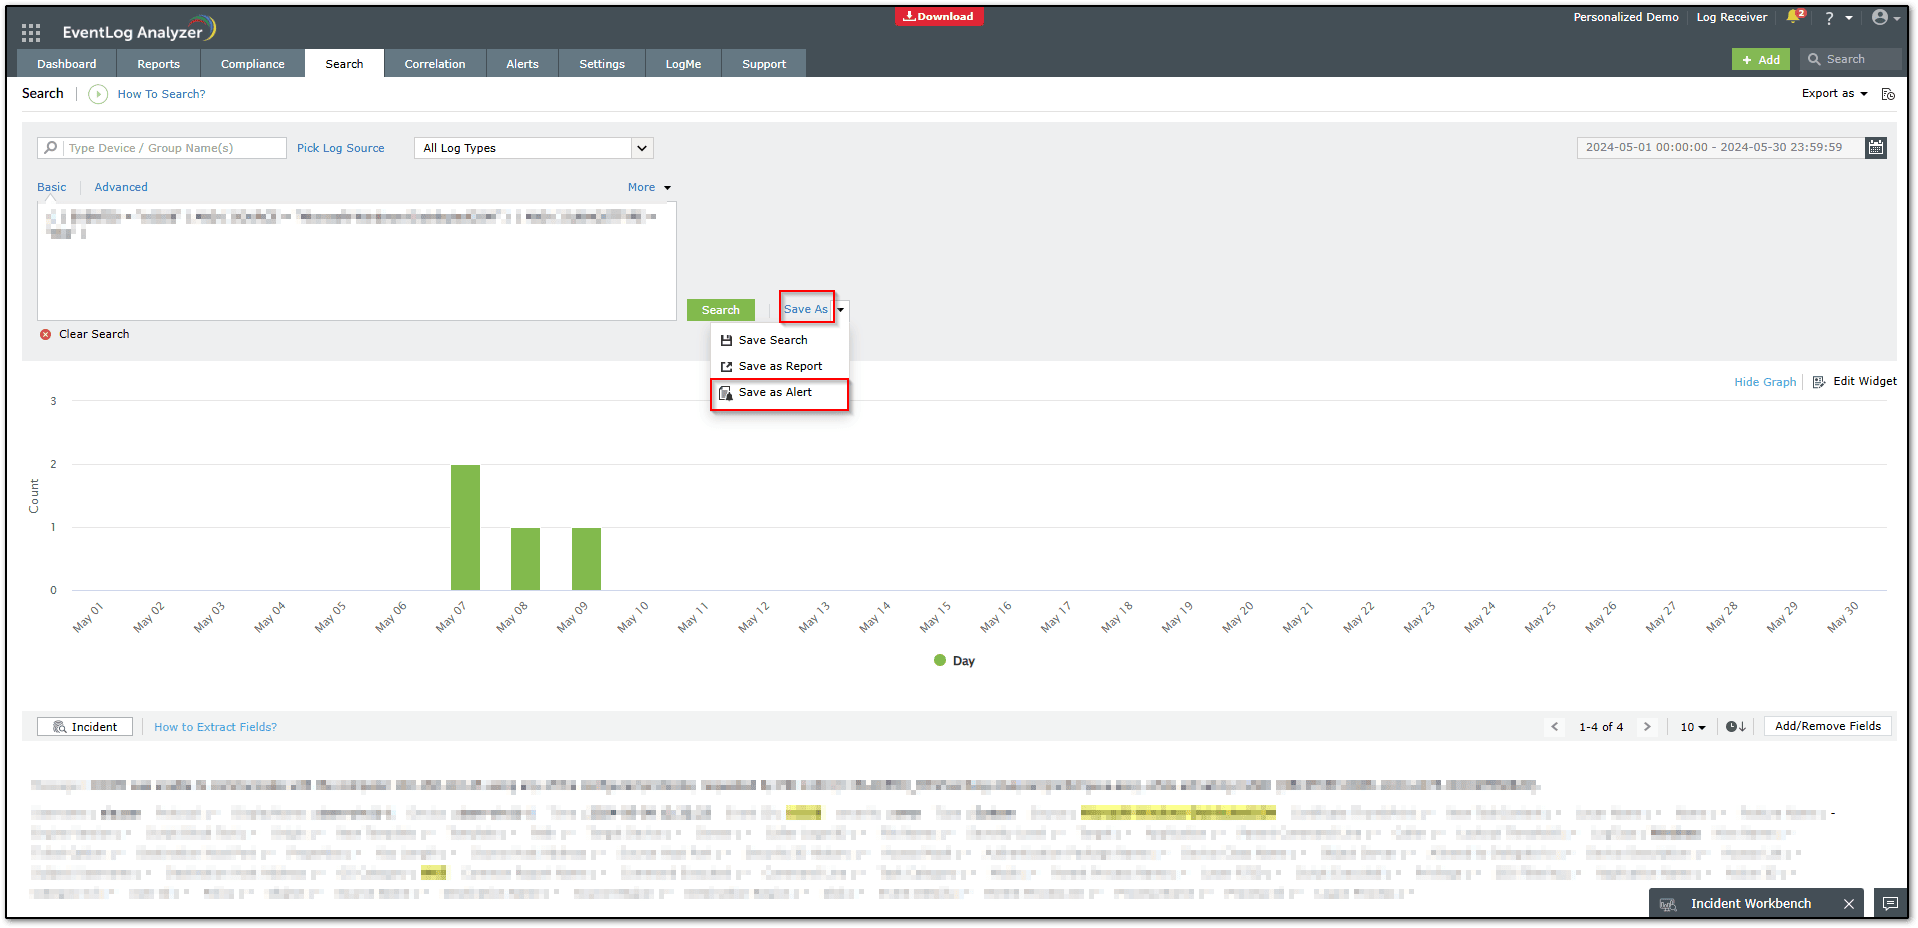
- The event is available in the Search tab but does not meet the criteria used:
If this is the case, you need to build the criteria in the Search tab to get the desired results and choose Save As > Save as Alert. See the image below.
Trigger an event and check if the log is collected by the application and if the alert is recorded. If the log is collected but the alert is not yet recorded, jump to step four.
Trigger an event and check if the log is collected by the application and if the alert is recorded. If the log is collected but the alert is not yet recorded, jump to step four.
- Events are not available in the Search tab:
If the events are not collected by the application, the alert engine will not record the alert. Follow the steps below:
- Navigate to Settings > Log source configuration. Check the time the action happened and the Last Message time of the log source to ensure events in the specified time range are collected by the application. Wait or update the monitoring interval (if available) to have the log collected. If the logs are collected for the time specified, proceed with the next step.
- Navigate to Settings > Admin Settings > Log Collection Filter and check if any filter policy configured may prevent log collection from the respective log sources, leading to the event not being collected.
- Check if the events are recorded natively and set the required configurations to have them recorded.
Step 4: Check the max alerts per alert profile limit
- On the Manage Profiles page, set Date & Time Range as Today and check the number of alerts being recorded per day.
- Navigate to Settings > Admin Settings > Product Settings and check the Daily Email Limit to validate if the daily limit has been reached. If yes, you can either increase it (preferred) or disable it as per usability. (The default value is 10,000.)
Step 5: Check for alert dumps
- Check <Installation Directory>\Data\AlertDump for unprocessed alert files.
- The alert dump is a temporary storage location where alert log files will be placed temporarily before indexing them in Elasticsearch. A file in the alert dump indicates the alert engine has flagged an event as an alert but the event is yet to be indexed in Elasticsearch. Once indexed, the data for the alert will be visible in the user interface.
- It's unlikely for files to be sent to the alert dump but can occur in the following cases:
- Insufficient system resources: Refer to the System Requirements and use the System Resource Calculator to estimate your requirements.
- Formation of CachedRecord due to resource starvation
Validation and testing
- Generate a sample event that matches the alert criteria.
- Check if the alert is recorded in the Alerts tab.
- Verify that the alert count is logged under the profile for the current day.
Tips
- Regularly monitor alert counts and thresholds.
- Configure alert email recipients with correct addresses and domains.
- Test alert profiles periodically to ensure continuous functionality.
How to reach support
If the issue persists after following the above steps, you can contact the ManageEngine EventLog Analyzer Support Team
Toll-Free (US): +1 844 649 7766

New to ADSelfService Plus?
Related Articles
Troubleshooting: Disk space issues in EventLog Analyzer
Issue description EventLog Analyzer server might run out of storage due to misconfiguration and other known factors. This article offers troubleshooting steps to resolve when your disk or drive where the application is installed is full and help you ...How to modify the maximum alerts per alert profile in EventLog Analyzer
Objective EventLog Analyzer allows administrators to control the number of alerts triggered by a single alert profile each day. This helps avoid alert overload, reduce system strain, and ensure that only relevant alerts are generated by preventing ...How to bulk delete the generated alerts in EventLog Analyzer?
Objective We understand that manually deleting individual alerts in EventLog Analyzer can be time-consuming and tedious, especially when dealing with a large volume of alerts. This document is intended to simplify that process by providing ...Windows agent not communicating with EventLog Analyzer server
Issue description When the agent fails to communicate with the EventLog Analyzer server, the log transfer between devices is disrupted. As a result, logs accumulate on the agent machine until connectivity is restored. This delay in log transmission ...Unable to start EventLog Analyzer
Issue description This issue occurs when the EventLog Analyzer service fails to start, or when users are unable to access the web client through the browser (typically on ports 8400 or 8445). Users may experience one or more of the following ...