SDPC Reporting FAQ's

1. How can we generate a technician login report?
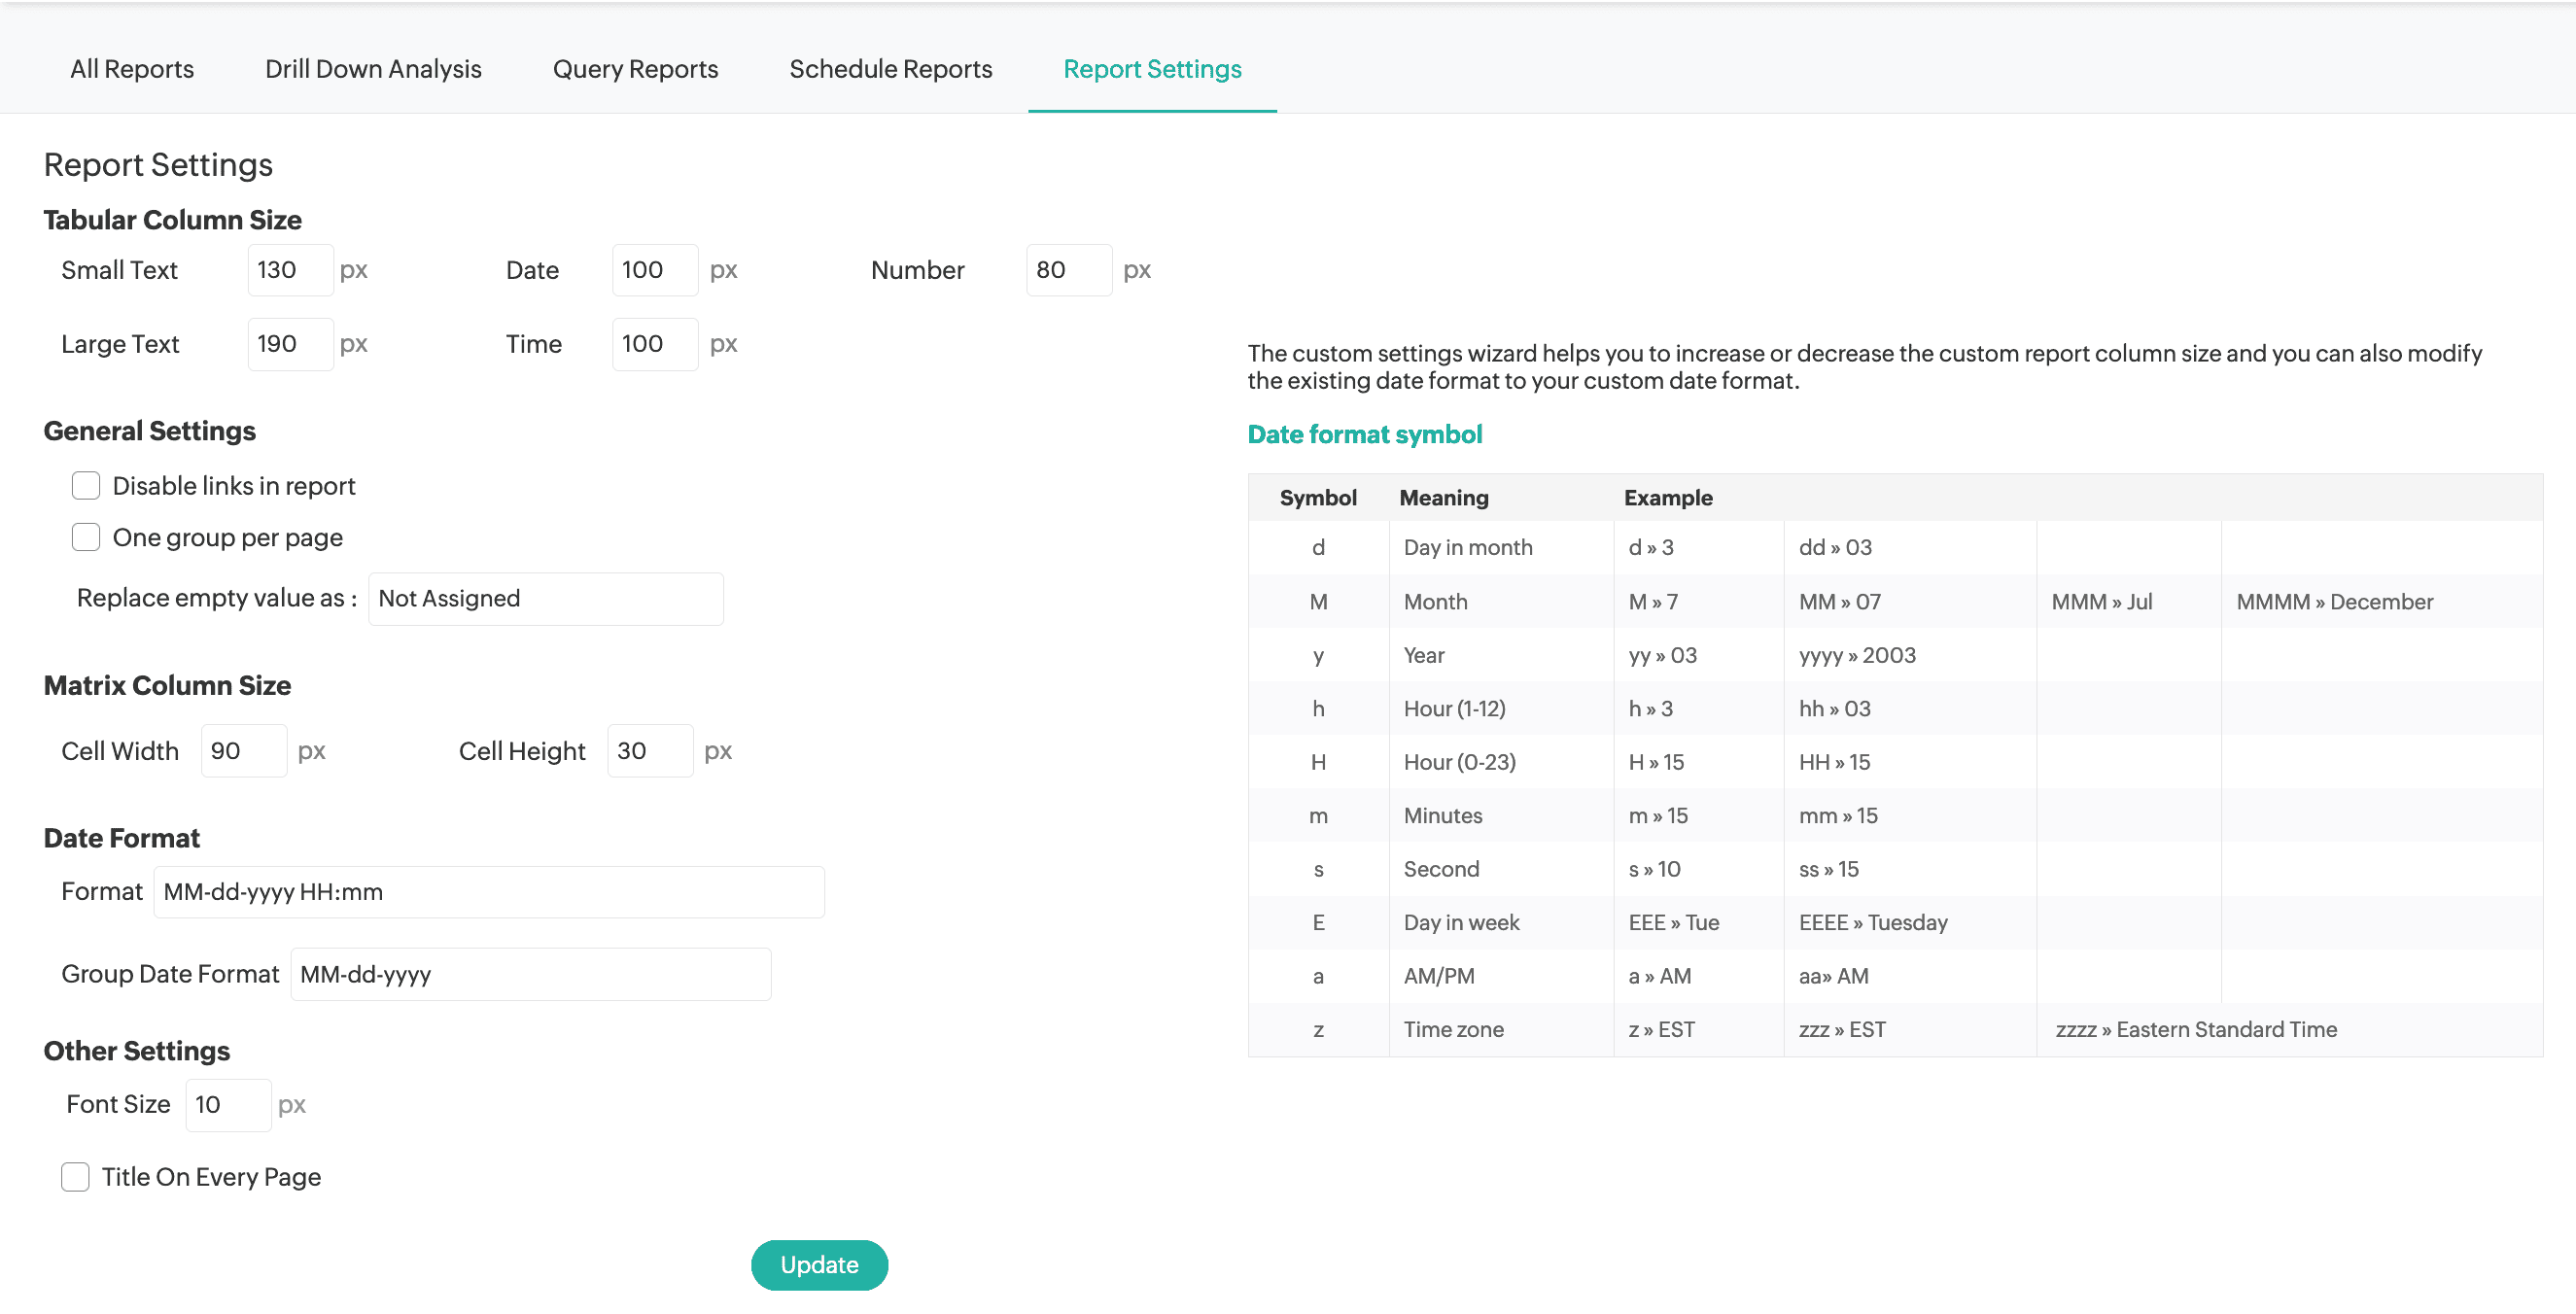
2. How can I change the date format of the reports generated from SDP Cloud?
You may click on the reports module, then click on report settings. Here, you can change the date format. (Screenshot attached below for reference)
3. Is it possible to customize a query report?
It is not possible to customize the query report once generated. Kindly share your detailed use case with our support to have it analyzed.
4. How can I hide the title from appearing on all pages of a report?
5. Why am I not receiving all my scheduled reports via email?
Also, you may navigate to Setup >> Data Administration >> System Log and search for the scheduled report to check if there was an issue while sending.
6. Why can't I find the description field in the request reports, and how can I enable it to be part of the report column?
7. While generating the report, the year in the date field is being displayed incorrectly.
8. While generating the report, there are fields that are being duplicated but proper data is not rendering in both the fields.
9. How to export organization roles?
10. How to replace "not assigned" for the empty value in the reports?
To change the value for empty value records in the reports generated from SDP Cloud application, navigate to Reports > Report settings > Edit "Replace empty value as"
PowerBI Integration :-
Do we support both Power BI Desktop and Power BI Service in our integration?
What modules are currently supported for Power BI synchronisation?
Module | Sub Modules |
Requests | Assets CIs Assessment (status/group/technician) Metrics Tasks Worklogs |
Users | Requester Technician Technician Associated Sites Technician Associated Groups |
Assets | Asset History Asset Loan Workstation & Virtual Machines/Hosts Software & Software Licenses |
CMDB | CI Relationships CI Types Downtime |
CHANGES | CIs Conversations Downtime CAB Members Roles Services Affected Tasks/Worklogs |
CONTRACTS | CIs Conversations Renewals Statistics |
Projects | Milestones Tasks/Worklogs Comments Members |
Problems | Assets CIs Conversations Tasks/Worklogs Services Affected
|
Purchase Order | Items/Invoices/Payments Notification |
Release | Assets CIs Conversations Tasks/Worklogs Services Affected Downtime Roles |
Solution | Topic Comments |
Approvals | Approval Level Approvals |
What is the sync frequency set for this integration with Power BI?
The sync frequency is set to 2 hours at the moment.
What are the current limitations in Power BI related to this integration?
What permissions should the logged-in user have in both Power BI and SDP Cloud?
The signed in user in PowerBI should be a SDAdmin in SDP Cloud.

New to ADSelfService Plus?
Related Articles
Admin Related FAQ's
For detailed configuration steps, please refer to our Help Guide. 1. What is the architecture of ServiceDesk Plus Cloud and its framework? ServiceDesk Plus Cloud application is hosted in our proprietary SaaS framework in our own data centres . ...ServiceDesk Plus Cloud Artificial Intelligence Related FAQ's
1. What is Zia? Does Zoho have its own LLM? Zia (Zoho's Intelligent Assistant) is Zoho’s in-house AI assistant integrated across various Zoho applications, including ServiceDesk Plus Cloud. It helps users with features like chatbot, solution ...General - Request FAQ's
For detailed configuration steps, please refer to our help guide. 1. An user reports seeing "Not Authorized" in certain fields within the request list view. How should I address this issue Kindly navigate to Set up --> Templates & Forms and edit the ...CMDB FAQ's
For detailed configuration steps, please refer to our help guide. CMDB Module :- Configuration Management Database (CMDB) is a centralized repository used to store information about all the significant entities in your IT environment. The CMDB acts ...Problem Module FAQ's
For detailed configuration steps, please refer to our help guide. 1. What is Problem Management, and why is it required? Problem Management is a key component of IT Service Management that focuses on identifying, analysing, and resolving the causes ...