APM Insight monitor is UP, but monitor page doesn't show any data
Possible Causes
The APM Insight monitor status corresponds to the respective agent folder pointed Java Application status i.e., as long as the Application server is running, the monitor status will be UP.
1. No Transactions Recorded: It is possible that the application being monitored doesn't have any transactions in the selected time window. In such cases,
perform some transactions and check after some time.
2. Unsupported JVM/JDK: Your application might be using an unsupported JVM/JDK. Kindly check the list of supported JVM/JDK.
3. Unsupported Applications Server: Your application might be using an unsupported Application server. Kindly check the list of supported Application servers.
4. Unsupported Components or Frameworks: Your application might be using some unsupported components or frameworks. Kindly check the list of supported components and frameworks.
5. Unsupported Database: Your application might be using an unsupported database. Kindly check the list of supported databases.
6. Adjust Time Window: If older data is available but not collected due to no recorded transactions, extend the time window to a period when transactions were expected. By default, you can view the last 7 days of data for APM Insight applications.

If you are using an unsupported elements (JVM/JDK, application server, components, frameworks, or database), drop a word at appmanager-support@manageengine.com with following diagnostics:
Contact Support with Diagnostics
If the issue persists, Change the agent logs level to DEBUG mode by following the below steps:
1. From Application Manager Console, Navigate to the APM tab -> Your APM Applications/Instances -> Monitors Actions -> Edit -> Edit APM Insight Agent Configuration Profile -> Change the Logging Level to DEBUG and Save 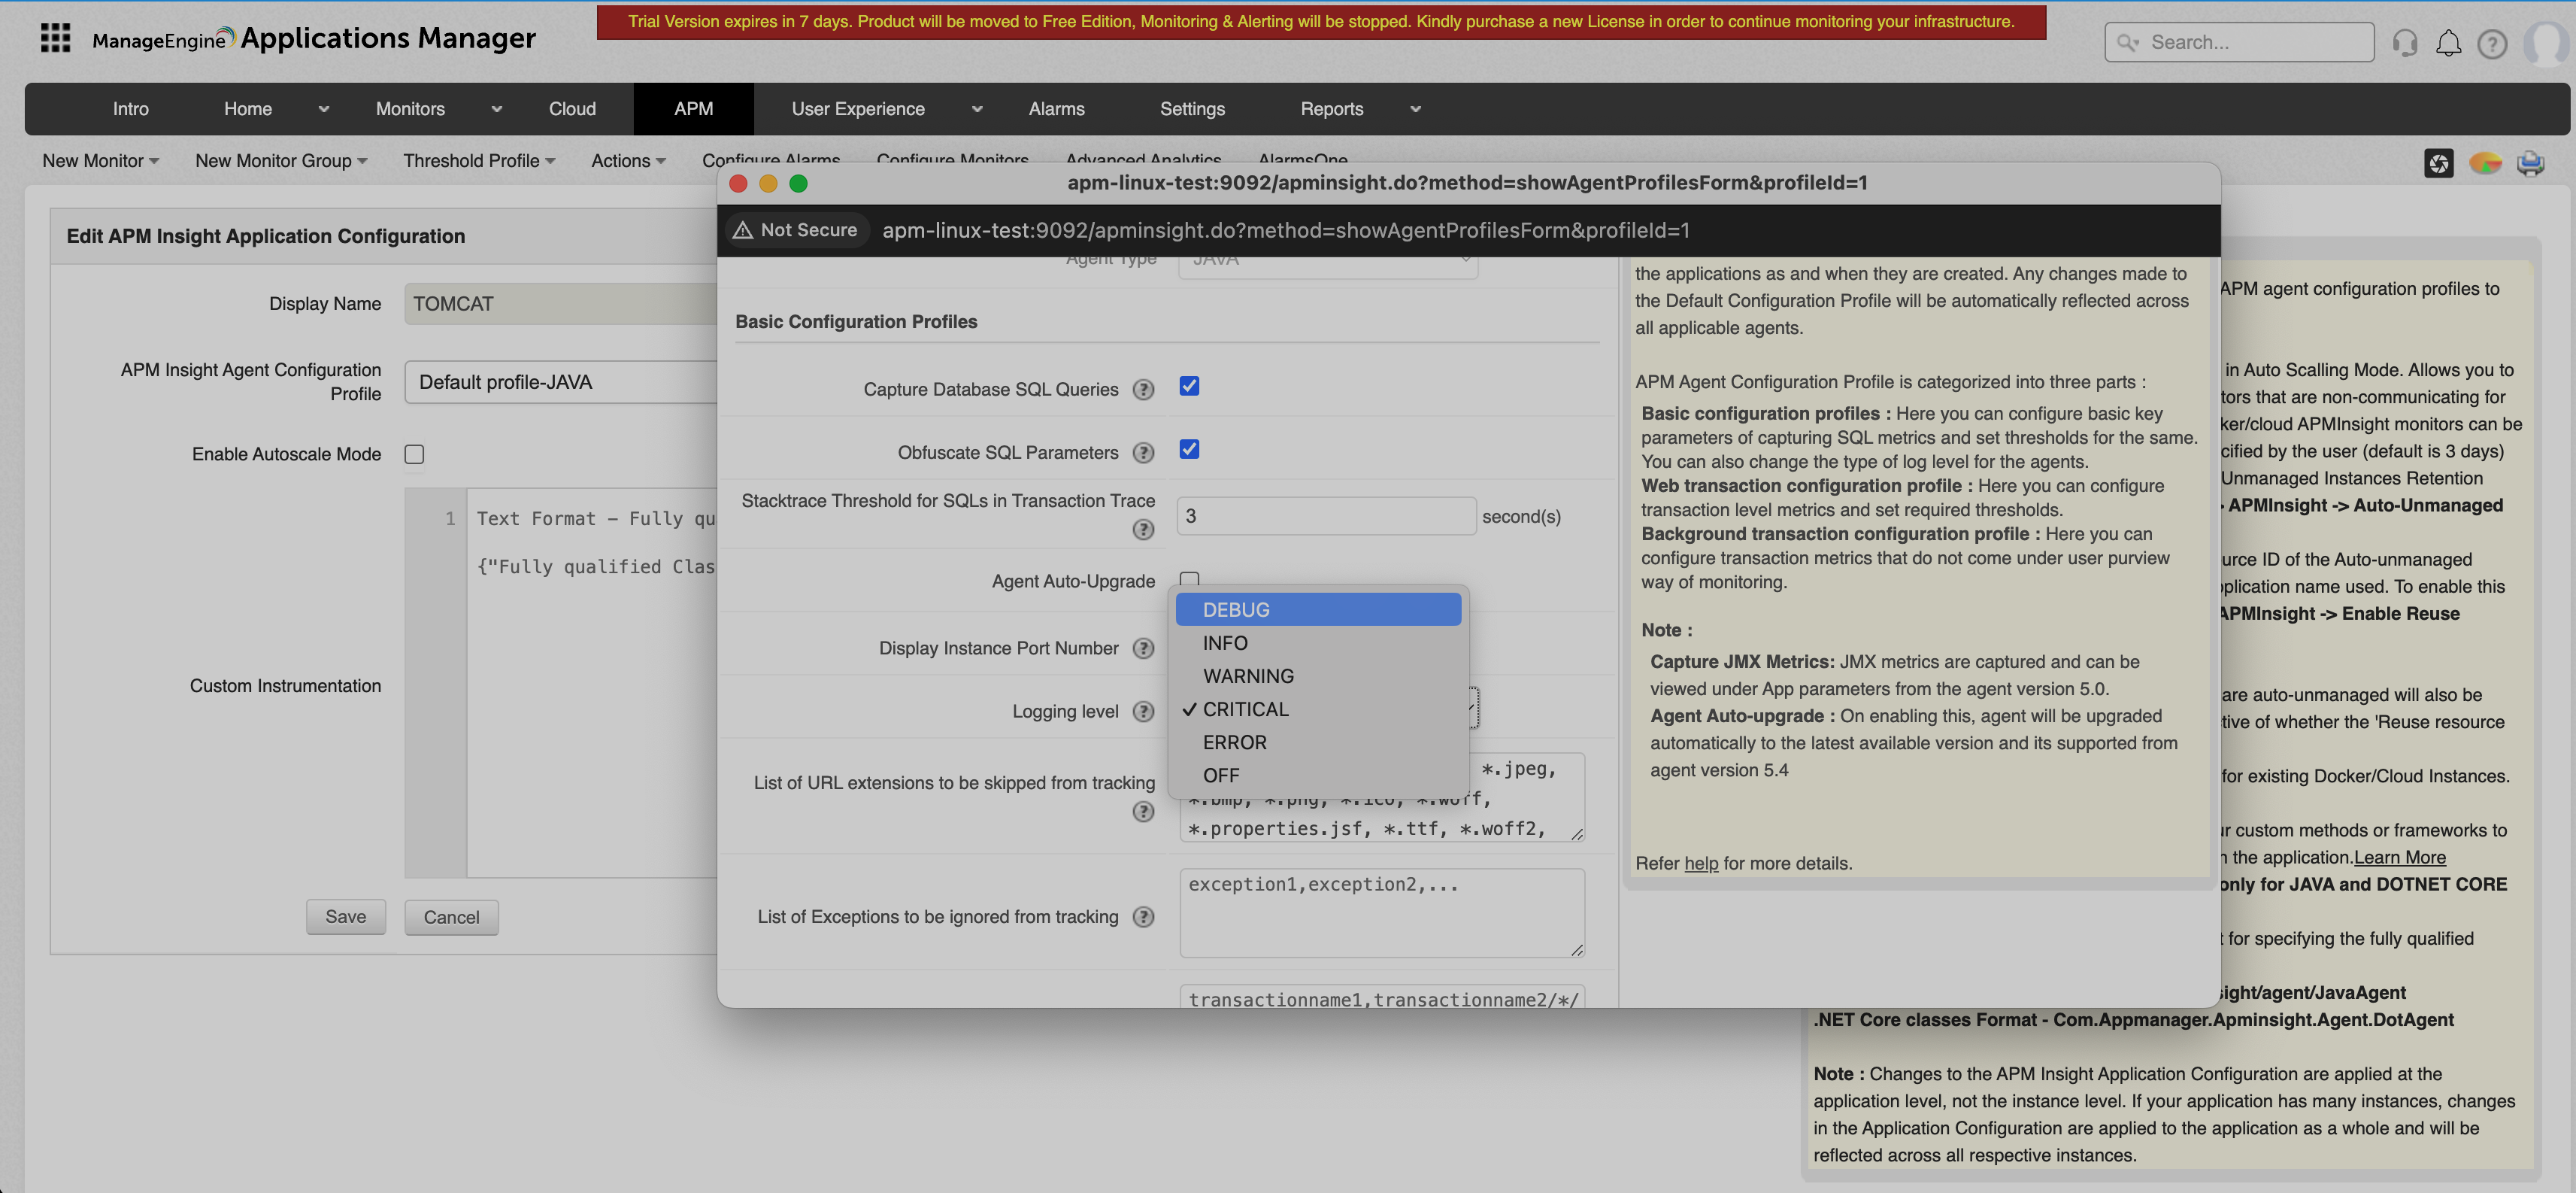
2. Perform some transactions on the application for few mins to analyze the data collection
3. Then, Contact appmanager-support@manageengine.com along with the updated Agent diagnostics for further assistance

New to ADSelfService Plus?
Related Articles
Self monitor Applications Manager using APM Insight Java Agent
Applications Manager is built with Java, hence we can monitor it using APM Insight Java Agent to measure it's performance continuously, which can be very much useful. Setting up APM Insight Java Agent Follow the below steps to download and set up the ...Troubleshoot - Duplicate APMInsight Monitors
Introduction: Duplicate monitors might be created in APMInsight due to various reasons. This article will help you identify and resolve the issue of duplicate monitors. The common causes include: - Changes in monitor configuration. (apminsight.conf ...APM Insight monitor is UP, but monitor page doesn't show any data
Possible Causes The APM Insight monitor status corresponds to the respective .NET agent's service status i.e., as long as the .NET agent service is running, the monitor status will be UP (starting with .NET agent version 4.7). 1. No Transactions ...APM Insight monitor is UP, but monitor page doesn't show any data
Possible Causes The APM Insight monitor status corresponds to the respective .NET Core application process(w3wp.exe) status i.e., as long as the NET Core application process(w3wp.exe) is running, the monitor status will be UP. 1. No Transactions ...Uninstrumented Block of Code - APM Insight
In the traces tab --> Slowest Method Calls and Count we show if you find Un-instrumented block of code the reason is as follows: Basically, What is un-instrumented block of code in APM Insight? By default, APM Insight agent monitors known frameworks ...