[DidYouKnow-41] Glowroot bundled with ServiceDesk Plus
Glowroot is now bundled with ServiceDesk Plus and available from 11124 builds onwards.
Note: This tool is not enabled by default and need not be enabled until explicitly told so for performance monitoring by a ServiceDesk Plus developer, Glowroot can be very useful to find the root cause of application issues like slowness or general performance checks. However, keeping the Glowroot enabled for a long duration will lead to an unwanted increase in disk space on ServiceDesk Plus Server and it would be consuming the scarce performance-resources on the server as well in order to monitor. After collecting logs, the Glowroot needed to be disabled for regular use.
Data Deletion: Access the Glowroot from the application server by accessing URL http://localhost:4000 Goto Settings >> Administration >> Storage.
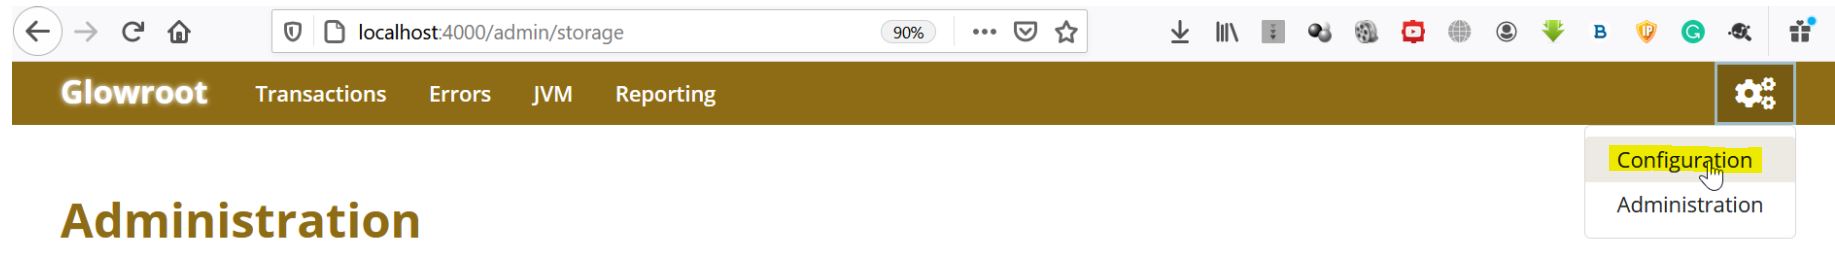
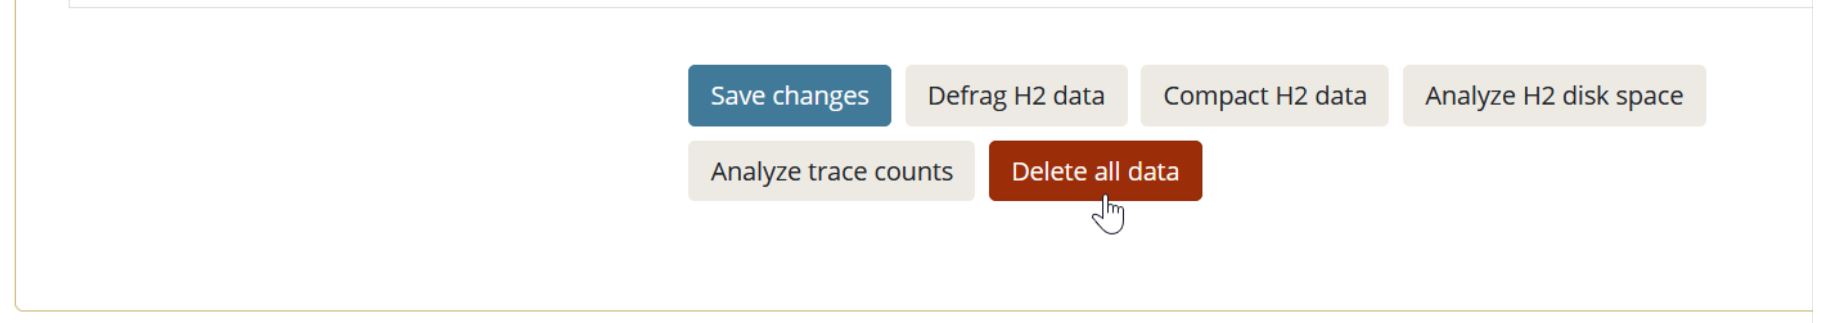
Scroll to the end of the page and click Delete all data.
Steps to enable Glowroot:
- Stop the ServiceDesk Plus service.
- Uncomment the entry "wrapper.java.additional.*=-javaagent:../glowroot/glowroot.jar" in wrapper.conf [Manageengine\ServiceDesk\Conf ]
- ( for Windows) Uncomment the entry "set JAVA_OPTS=%JAVA_OPTS% -javaagent:"%SERVER_HOME%\glowroot\glowroot.jar"" in RUN.bat [Manageengine\ServiceDesk\Bin]
- (for Linux) Uncomment the entry "JAVA_OPTS="$JAVA_OPTS -javaagent:$SERVER_HOME/glowroot/glowroot.jar"" in RUN.sh [Manageengine\ServiceDesk\Bin]
- Start the ServiceDesk Plus service.
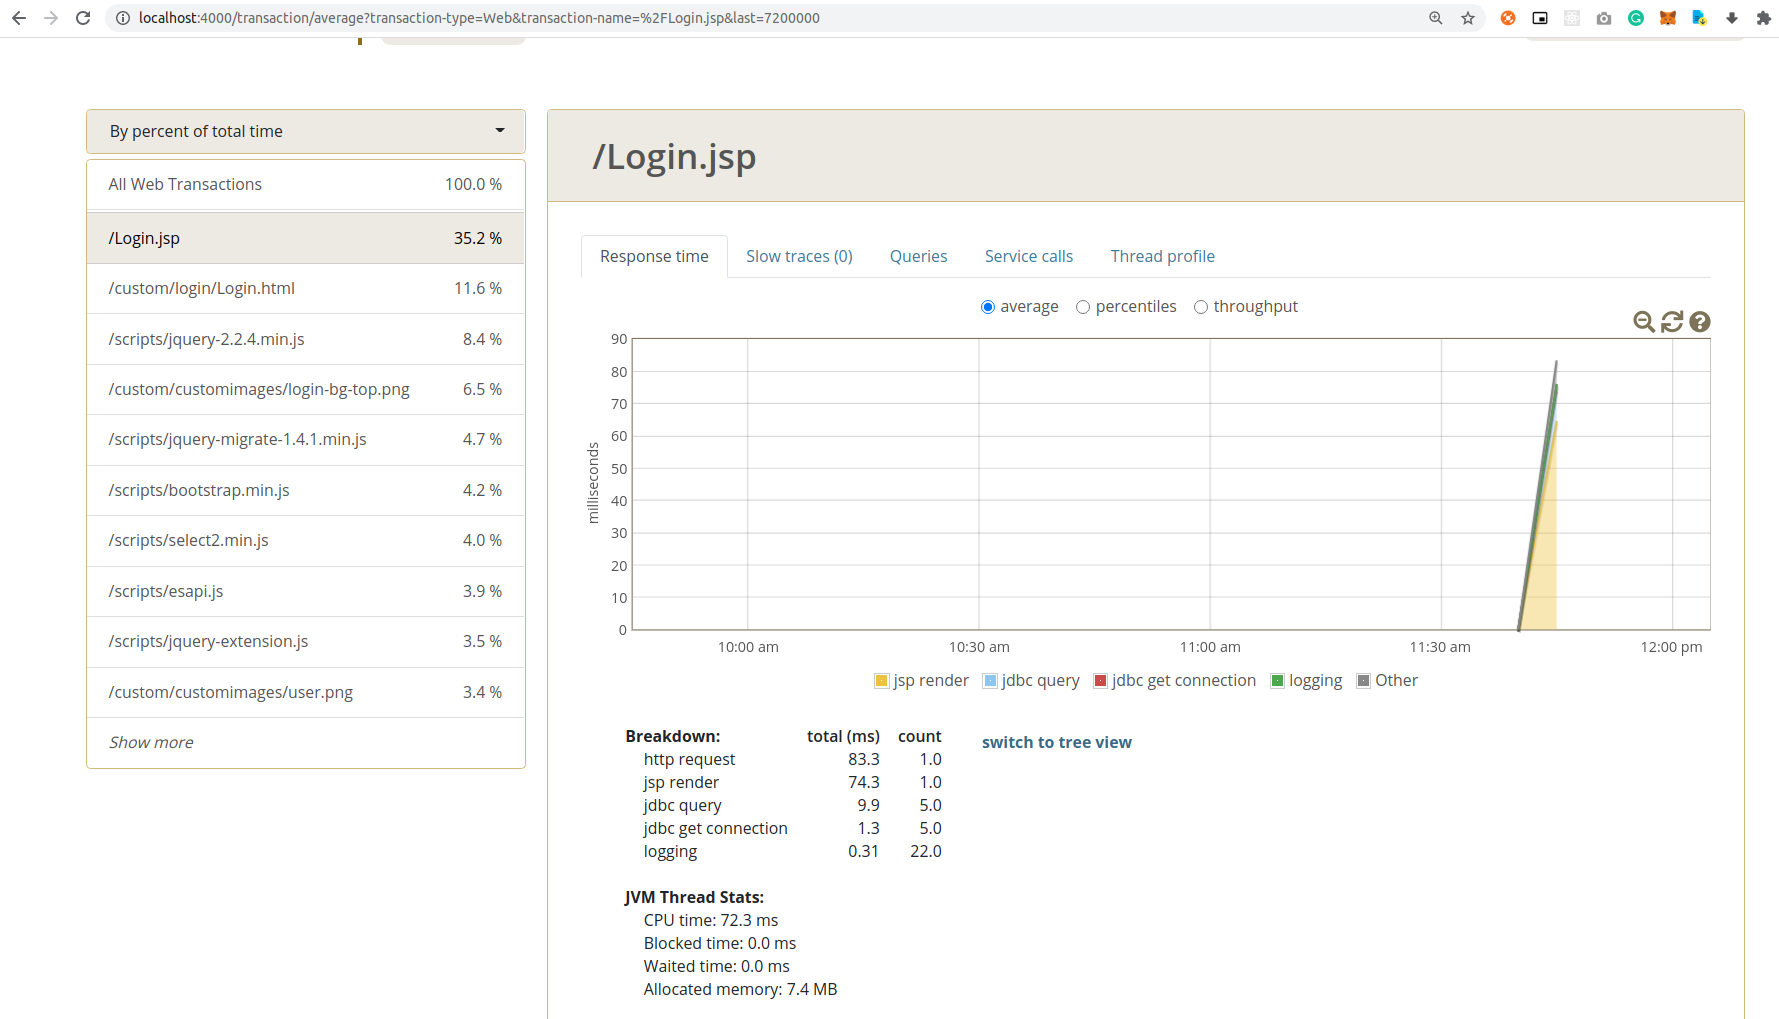
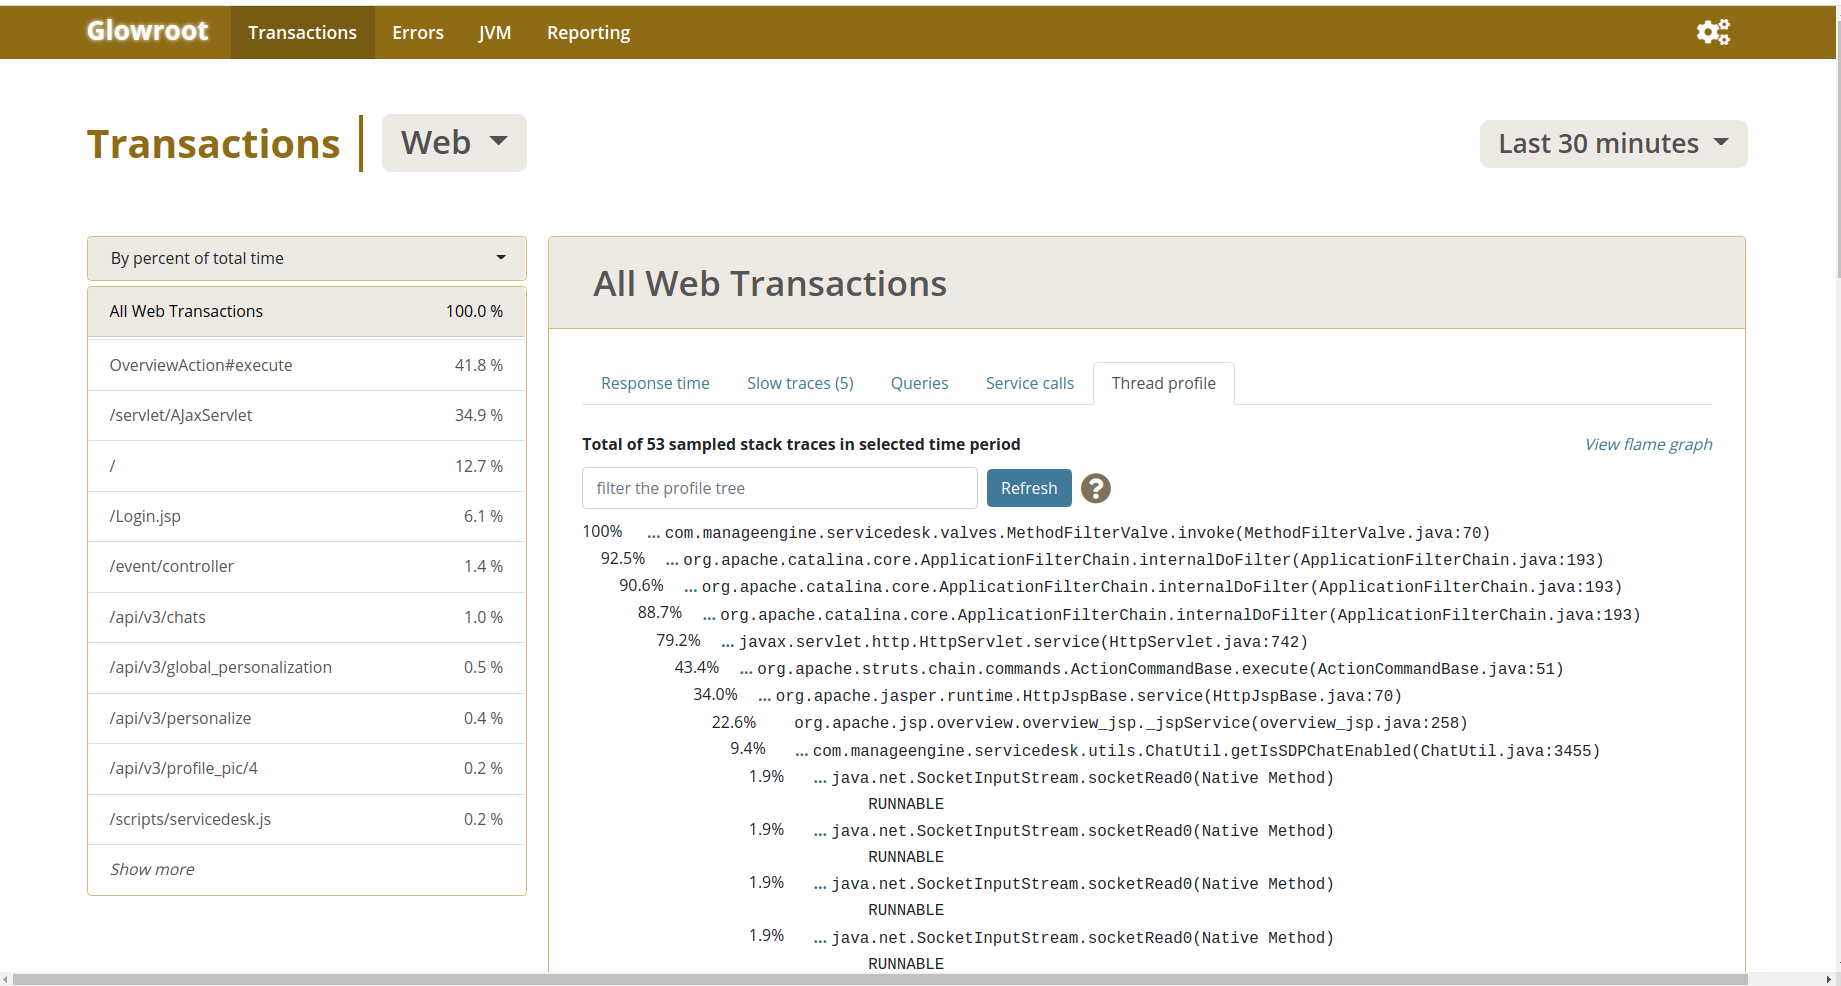
- Live data collected can be viewed by accessing the URL http://localhost:4000 from the application server.
Note: By default, Glowroot can be accessed only from the localhost/server alone and not from your domain for security reasons.