[DidYouKnow-37] Database Maintenance settings
Database performance is such a critical factor of any application/network. IT organizations are always chasing better performance that involves monitoring, tuning, and improving applications database as a crucial activity.
Because of indices and other performance improvements, databases consume a LOT more disk space than what the actual data itself requires. Hence, monitoring the disk usage on the database server is vital to avert application crash or failure and to sustain optimal performance.
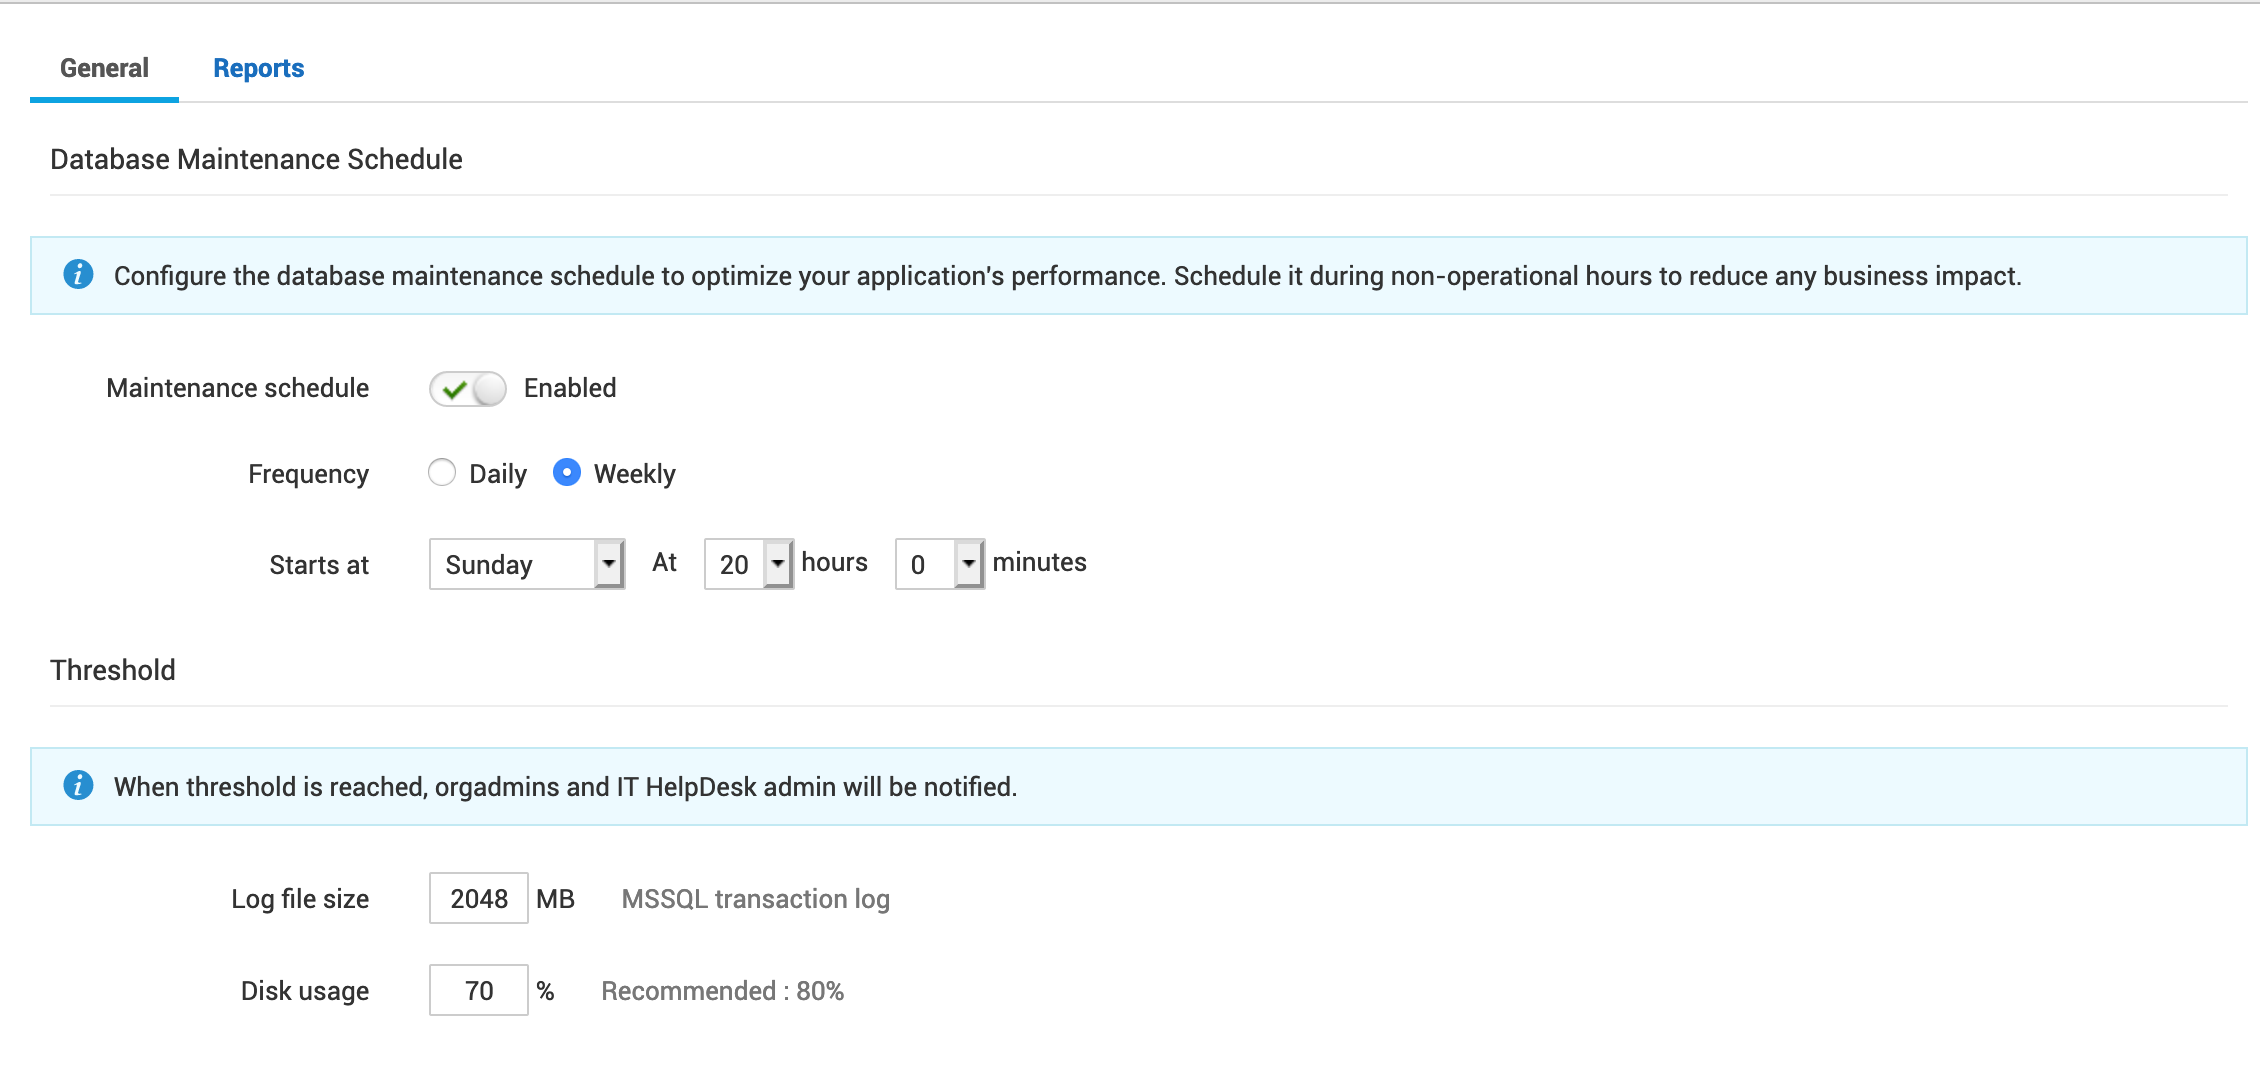
With ServiceDesk Plus build 11106, we released a feature that enables you to configure various database-related settings to improve stability and performance of the application such as database maintenance scheduling and configure disk usage threshold to optimize the performance.
This can be configured from Admin > General settings > Performance settings.
You can schedule database maintenance. The query optimizer uses table statistics to create query plans. To ensure optimal performance of query plans, the table statistics must be updated regularly.
This database maintenance activity is carried out differently in different database systems.
In the case of Postgres, the operation "VACUUM ANALYZE" is used and in the case of MS SQL, the operation "sp_updatestats" is used.

MS SQL server maintains a transaction log file (.LDF) to record all transactions. This could grow large and fill up the disk if left unmonitored and cause application downtime.
To prevent this, an additional option is enabled for MS SQL users to configure the log file size threshold.
When the database server reaches its specified threshold, a notification will be triggered to OrgAdmin and IT HelpDesk Admin users.
This helps the IT team to take proactive measures to ensure you have lots of storage available for your database server to have optimal health thus optimal application performance.
You would want to check our previous post on Contract Management Lifecycle.
Topic Participants
Dinesh Bhaskaran
Thad Orrell
Michael W
paul.farah
New to M365 Manager Plus?
New to M365 Manager Plus?
New to RecoveryManager Plus?
New to RecoveryManager Plus?
New to Exchange Reporter Plus?
New to Exchange Reporter Plus?
New to SharePoint Manager Plus?
New to SharePoint Manager Plus?
New to ADManager Plus?