No data or logs collected from syslog device
Issue description
During the initial setup or while using EventLog Analyzer, you might notice that logs are not being collected from a syslog device or that syslog device reports do not show any recent data. EventLog Analyzer uses device status indicators to help identify such issues, including:
- Log Forwarding is not configured: Appears immediately after manually adding a device, indicating no log packets have been received yet.
- Device not reachable: Device does not respond to ping from the EventLog Analyzer server (logs may still flow in some cases).
- Logs not forwarded: No logs received for more than 24 hours; this status clears automatically when logs resume.
- Agent down / Log collector down: The log collector service is unavailable; syslog and Windows log collection may be impacted (agent-based collection may continue).
This article offers you the troubleshooting steps/solution for cases where syslog collection is not happening or syslog device reports do not have any recent data in EventLog Analyzer.
Possible causes
- Syslog misconfiguration: Log forwarding is not enabled or misconfigured on the device/application.
- EventLog Analyzer server IP/hostname change: Device not updated to send logs to the current server address.
- Port mismatch or restriction: Device forwarding logs to a different port or port is blocked. (Default: TCP 514; UDP 513, 514). Refer Listener Port settings to view/configure the port listened by EventLog Analyzer.
- Network restrictions — Firewalls, ACLs, NAT, or routing issues blocking syslog packets..
- Log Collection Filter - Filters in EventLog Analyzer may be unintentionally excluding logs.
- Timezone/date mismatch - Difference is date/time between syslog source and EventLog Analyzer server.
- Log collector down: The syslog collector (SysEvtCol) is not running.
- CachedRecords backlog: Unprocessed logs accumulated at <Installation Directory>/EventLog Analyzer/ES/CachedRecord.
- Incorrect source type — Windows-hosted apps forwarding syslog should be added as Syslog Application (not as Device).
Prerequisites
- Syslog forwarding enabled on the device/application (refer to vendor documentation for correct setup).
- Access to EventLog Analyzer server and User Interface as administrator.
- Access to the respective syslog source and knowledge about the source.
- Knowledge of source type:
- Physical network device → add as Syslog Device (consumes Device license)
- Application hosted on Windows → add as Syslog Application (consumes Application license)
- Supported formats: Log Sources has to forward the logs in the standard formats(BSD Syslog Protocol): RFC 5424, RFC 3164, or CEF.
- Communication from Unix/Linux device to EventLog Analyzer.
- The syslog packets will be forwarded from Syslog source to EventLog Analyzer server.
- The port syslog forwarder port has to be allowed in such way the traffic reached application in source(outbound), intermediate devices/application(security application/network level firewall/proxy) and destination(inbound).
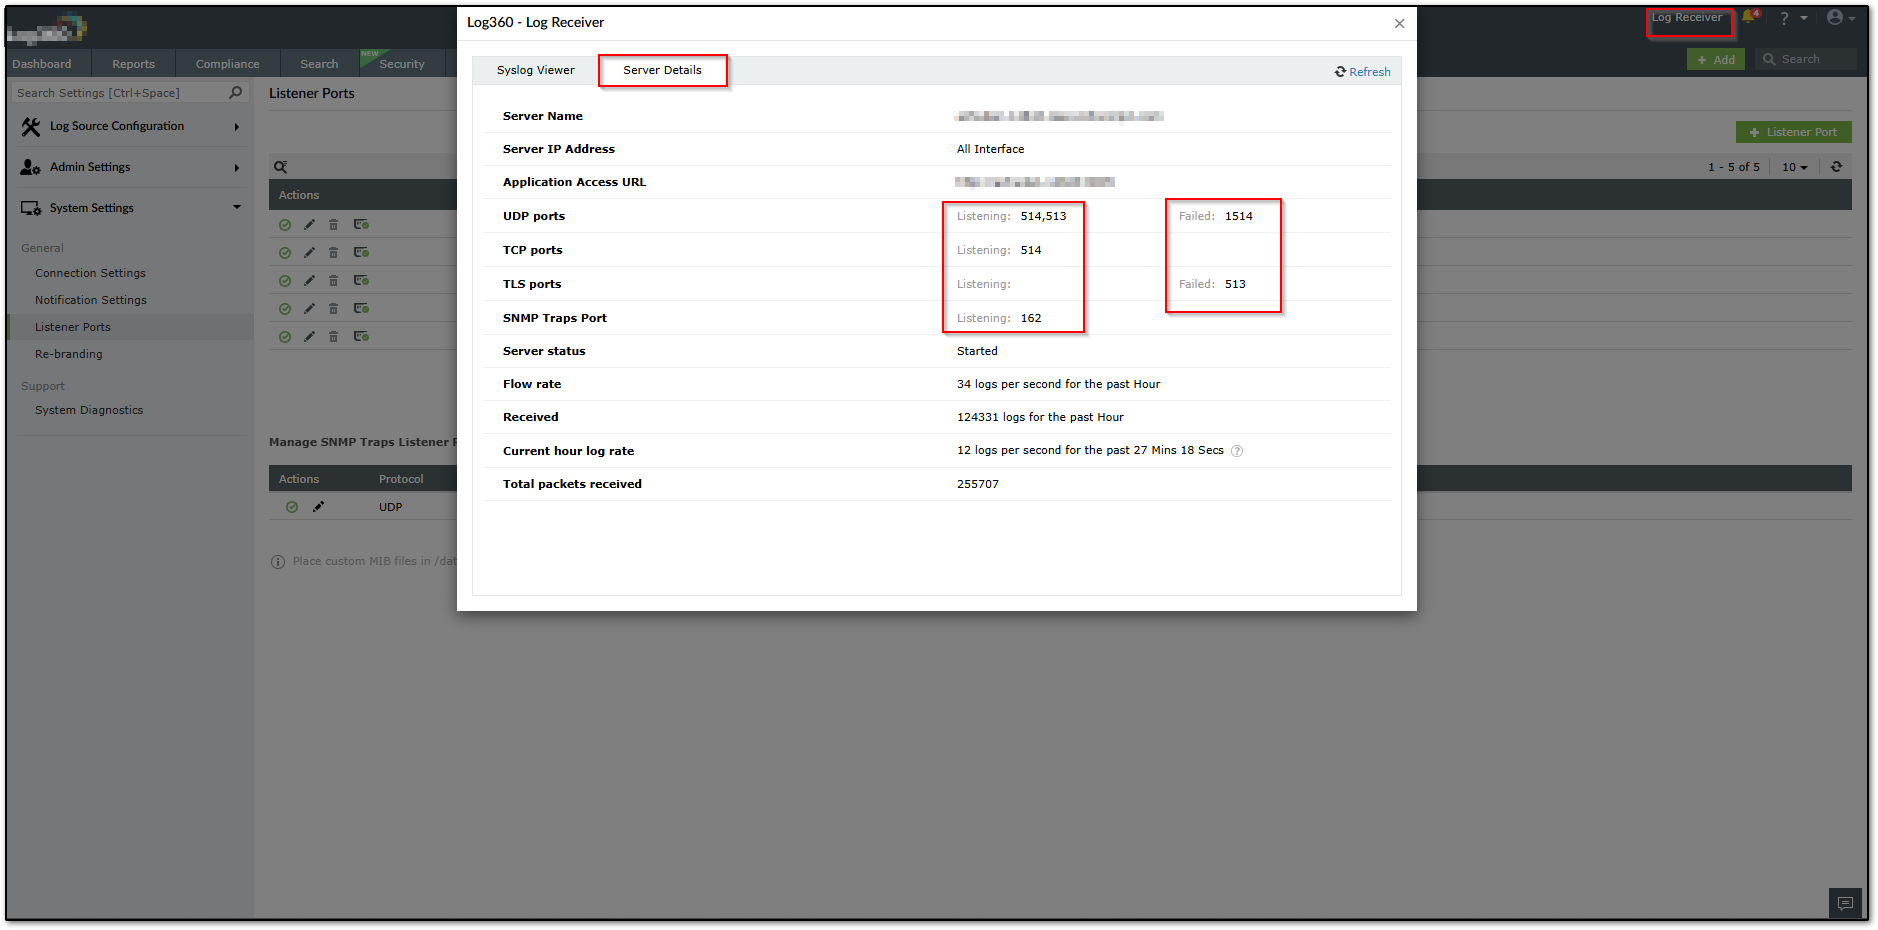
- Verify listener readiness
- Choose Log Receiver(top right corner) → Server Details → the port shows Listening
- Or Listener Port Settings reflects the correct protocol/port and is not occupied.
The port is flagged Listening when available for use and not already bound by another process/service.
Resolution steps
Identify the impact:
- If all (or most) devices impacted, including Windows sources proceed with Scenario 1: All devices.
- If only specific syslog device(s) impacted, proceed with Scenario 2: Specific device(s).
If you already see packets in Live Syslog Viewer, skip to Scenario 2 → Case 1.
Scenario 1 — All devices affected
1.1 Check CachedRecords backlog and system capacity
- Navigate to <InstallDir>/EventLog Analyzer/ES/CachedRecord.
- Note the file count. If it keeps increasing, your server may be under-provisioned or the pipeline is stalled.
- Ensure the EventLog Analyzer server is configured as per recommended System Requirements.
- If backlog keeps rising, Refer CachedRecord Troubleshooting
1.2 Verify Log Collector service health
- If logs are not collected from all types (except agent-installed machines and few applications for which logs are imported), the Log Collector may be down.
- Check the Log Collector(SysEvtCol) service status; then refer to the Log Collector Troubleshooting KB (see Related).
1.3 Confirm listener ports and conflicts
- Navigate to Settings >> System Settings → Listener Port Settings
- Validate the configured UDP/TCP ports match what devices are sending to.
- Confirm Log Receiver → Server Details shows Listening.
- OS-level port availability check:
Windows:
i. Powershell Command:
netsh advfirewall firewall show rule name=all | findstr "<PORTNUMBER>"
Replace the <PORTNUMBER> with port number.
ii. Resource Monitor:
Open Resource Monitor and Navigate to Network >> Listening Ports.
Ensure the SysEvtCol.exe process listens for the ports configured in Listener Port settings and Firewall Status is marked as Allowed, not restricted (Image Below)
iii. Using Windows Firewall with Advanced Security (GUI)
- Open Server Manager → Tools → Windows Defender Firewall with Advanced Security.
- Go to Inbound Rules.
- Look for a rule that allows the specific port (check Local Port column).
Linux:
i. To check if port is allowed (firewalld):
sudo firewall-cmd --query-port=<PORTNUMBER>/<PROTOCOL>
Replace the <PORTNUMBER> with port number. <PROTOCOL> with required protocol(TCP/UDP)
Example: sudo firewall-cmd --query-port=22/tcp
ii. To Check a specific port:
sudo ufw status | grep <PORTNUMBER>
Replace the <PORTNUMBER> with port number
- If the port is used by another process, either stop the conflicting process or change the listener port in Listener Port settings and update devices accordingly.
1.4 Network path checks
- Ensure perimeter/segment firewall rules allow syslog traffic to the EventLog Analyzer server IP and port.
- If using NAT or load balancer, confirm the mapping to the correct internal IP/port.
- Check that the server's bind IP in Connection Settings matches the network configuration.
If after steps 1.1–1.4 you confirm packets are arriving, skip to Scenario 2 → Case 1 to handle application-level filtering, parsing, or timezone.
Scenario 2 — Specific syslog device(s)
2.1 Use built-in Log Receiver (packet view)
- Choose Log Receiver(top right corner) → Live View (or Server Details panel).
- Check if incoming packets from the specific device/IP are visible.
- You can also test the packets using any third party packet capture tool.
Now follow the matching case:
Case 1: Packets are visible in Log Receiver/Packet Capture tool.
Case 2: Packets are not visible in Log Receiver/Packet Capture tool.
Case 1 — Packets are visible in Log Receiver
- Host firewall / security software
- Check if the port is not restricted in Local host Firewall as per OS-level port availability check:
Windows:
i. Powershell Command:
netsh advfirewall firewall show rule name=all | findstr "<PORTNUMBER>"
Replace the <PORTNUMBER> with port number.
ii. Resource Monitor:
Open Resource Monitor and Navigate to Network >> Listening Ports.
Ensure the SysEvtCol.exe process listens for the ports configured in Listener Port settings and Firewall Status is marked as Allowed, not restricted (Image Below)
iii. Using Windows Firewall with Advanced Security (GUI)
- Open Server Manager → Tools → Windows Defender Firewall with Advanced Security.
- Go to Inbound Rules.
- Look for a rule that allows the specific port (check Local Port column).
Linux:
i. To check if port is allowed (firewalld):
sudo firewall-cmd --query-port=<PORTNUMBER>/<PROTOCOL>
Replace the <PORTNUMBER> with port number. <PROTOCOL> with required protocol(TCP/UDP)
Example: sudo firewall-cmd --query-port=22/tcp
ii. To Check a specific port:
sudo ufw status | grep <PORTNUMBER>
Replace the <PORTNUMBER> with port number
- If the port is used by another process, either stop the conflicting process or change the listener port in Listener Port settings and update devices accordingly.
- Internal security controls
- Review NAC/IDS/IPS policies; ensure traffic on the syslog ports is not dropped post-arrival (e.g., local endpoint policy).
- Duplicate category check
- Settings → Log Source Configuration: ensure the device isn’t unintentionally added under another category that intercepts/changes handling.
- Log Collection Filter
- Navigate to Settings >> Admin → Log Collection Filter: Verify no filter is excluding the device, its facility, severity, or message patterns.
- If a filter exists that should not apply, disable or adjust it.
- Timezone & date alignment
- Mismatched device timezones can push events outside your viewing/reporting window.
- Check if the logs source is logging events in current date and note down the time. If you notice the timezone difference between EventLog Analyzer server and Log source, follow the below steps to update in EventLog Analyzer.
- Navigate to Settings → Log Source Configuration → Devices → Syslog device.
- Place the cursor on top of device name and select Update device icon.
- Choose Advanced and select the appropriate Timezone to match the device timezone.
Note: Logs are indexed based on the device’s own timestamp.
- Parsing vs. Search
- If logs appear in Search but not in Reports, this indicates a parser mismatch.
- See Log Parsing KB (Related) for enabling a compatible parser or creating a custom one.
If after these steps data still doesn’t show in reports, proceed to Validation and testing, then collect artifacts and contact Support.
Case 2 — No packets in Log Receiver
This means the server isn’t receiving the packets or the receiver isn’t reading them.
- External packet capture
- Temporarily use any packet capture tool on the EventLog Analyzer server to watch the syslog ports.
- If packets appear in the capture but not in Log Receiver, revisit Scenario 1 → 1.3 (port conflict/bind).
- Network path
- Validate L3/L4 connectivity from device to server (firewall, routes, ACLs, NAT, VLAN).
- If your device can test, send a test syslog to server:port and verify arrival.
- Binded IP address
- Navigate to Settings >> System Settings→ Connection Settings: Check the bound interface/IP.
- Set to the specific server IP or All interfaces, then Save Settings.
NOTE: Changing the Bind Address needs application restart. Restart EventLog Analyzer service once to take effect.
- Verify the change under Log Receiver → Server Details.
- Port/protocol alignment
- Ensure the log source forwards logs via the same protocol and port that EventLog Analyzer is listening on (e.g., UDP 514 vs. TCP 514).
- Device configuration
- Re-validate syslog target IP/hostname, port, and format (RFC 5424/3164 or CEF).
- If the sender is a Windows-hosted application, ensure it’s added as Syslog Application (not Device).
Validation and testing
- Live view: EventLog Analyzer → Log Receiver(Live Syslog Viewer) — confirm real-time messages appear.
- Raw logs: Search Tab → filter by source device/IP → set appropriate date range (consider timezone).
- Device status: Verify status is active and logs are being collected.
- Parsing: Confirm events are categorized (facility/severity/event type).
- If built-in parsing seems incorrect(Example: Source IP address parsed as port number or username), contact Support.
- For additional fields, refer Custom Log parsing to extract required fields.
- Usability: Generate a predefined report or set an alert to ensure logs support analytics/real-time use.
Tips
- Ensure correct DNS resolution for both device-to-server and server-to-device hostnames.
- Prefer UDP for high-volume syslog unless message reliability is critical.
- Use the Live Syslog Viewer during onboarding or when troubleshooting to verify log flow before scaling.
Related topics and articles
- Log Collector down — Troubleshooting
- How to create custom Log Parser Rules
- How to add and configure Syslog Devices
- Syslog collection in EventLog Analyzer
- Syslog Device Status - "Logs Not Forwarded"
- Listener Port settings
- Log Collection Filter
How to reach support
- EventLog Analyzer Build number and Product version
- Screenshots of device syslog settings and Listener/Connection Settings
- Log source details: type/make, on-prem or cloud, OS version, physical device or Windows-hosted application
- Sample raw logs, if available
- CachedRecord file count (if backlog observed) and a short timeline of the issue

New to ADSelfService Plus?
Related Articles
How to add or configure a Network device or Syslog device like Firewall, Switches or Router in EventLog Analyzer
Objective EventLog Analyzer offers auditing capabilities for various network devices like Firewall, Routers, Switches, etc for few widely used makes/manufactures as predefined support. Offered predefined support includes Reports, Parsing, Detection ...How to add Topsec device in EventLog Analyzer
Objective EventLog Analyzer collects logs from Topsec devices using the Syslog protocol. Syslog services has to be configured in Topsec Devices to have the logs forwarded to EventLog Analyzer. This article offers you step by step instructions to add ...How to add Unix/Linux device in EventLog Analyzer
Objective EventLog Analyzer collects logs from Unix/Linux devices using the Syslog protocol. Devices can be configured automatically from EventLog Analyzer user interface or manually from the respective log source. This article explains both methods ...Troubleshooting guide: No data available in a Compliance Report
Overview This document provides a technical explanation and resolution guide when there is no data being displayed under compliance reports in ManageEngine EventLog Analyzer. Compliance reports include regulatory standards such as PCI-DSS, HIPAA, ISO ...No data from Syslog devices
No data from Syslog devices Ensure that the Syslog device is configured to forward the logs to EventLog Analyzer Server. Click here to know more about Syslog configuration in the respective devices. In both Hardware and Software Firewall, ensure that ...