Microsoft Azure VM - Enabling Diagnostics extension for Windows & Linux VMs

- Diagnostic Extension is now considered a legacy approach and it is limited to some server distributions. It is recommended to switch to Azure Monitor Agent (AMA).
- From Applications Manager v171400, Azure monitor agent is supported. Refer here to know more.
Applications Manager can collect diagnostic metrics from Storage accounts in both public and private links, as long as the storage account is accessible from the machine where Applications Manager is installed. For additional information, please refer to this link.
Steps to enable Diagnostics in Applications Manager
- In respective Azure Virtual Machine's Edit Monitor Page, select Agent Type as Diagnostic agent.
- To monitor metrics in Applications Manager, follow the steps provided below.
Steps to enable Diagnostics extension for Windows VMs
2. Navigate to your virtual machine.
3. Click on 'Diagnostics settings' on the vertical pane. Select 'Agent' tab and click on 'Remove' at the bottom, as shown in the below image: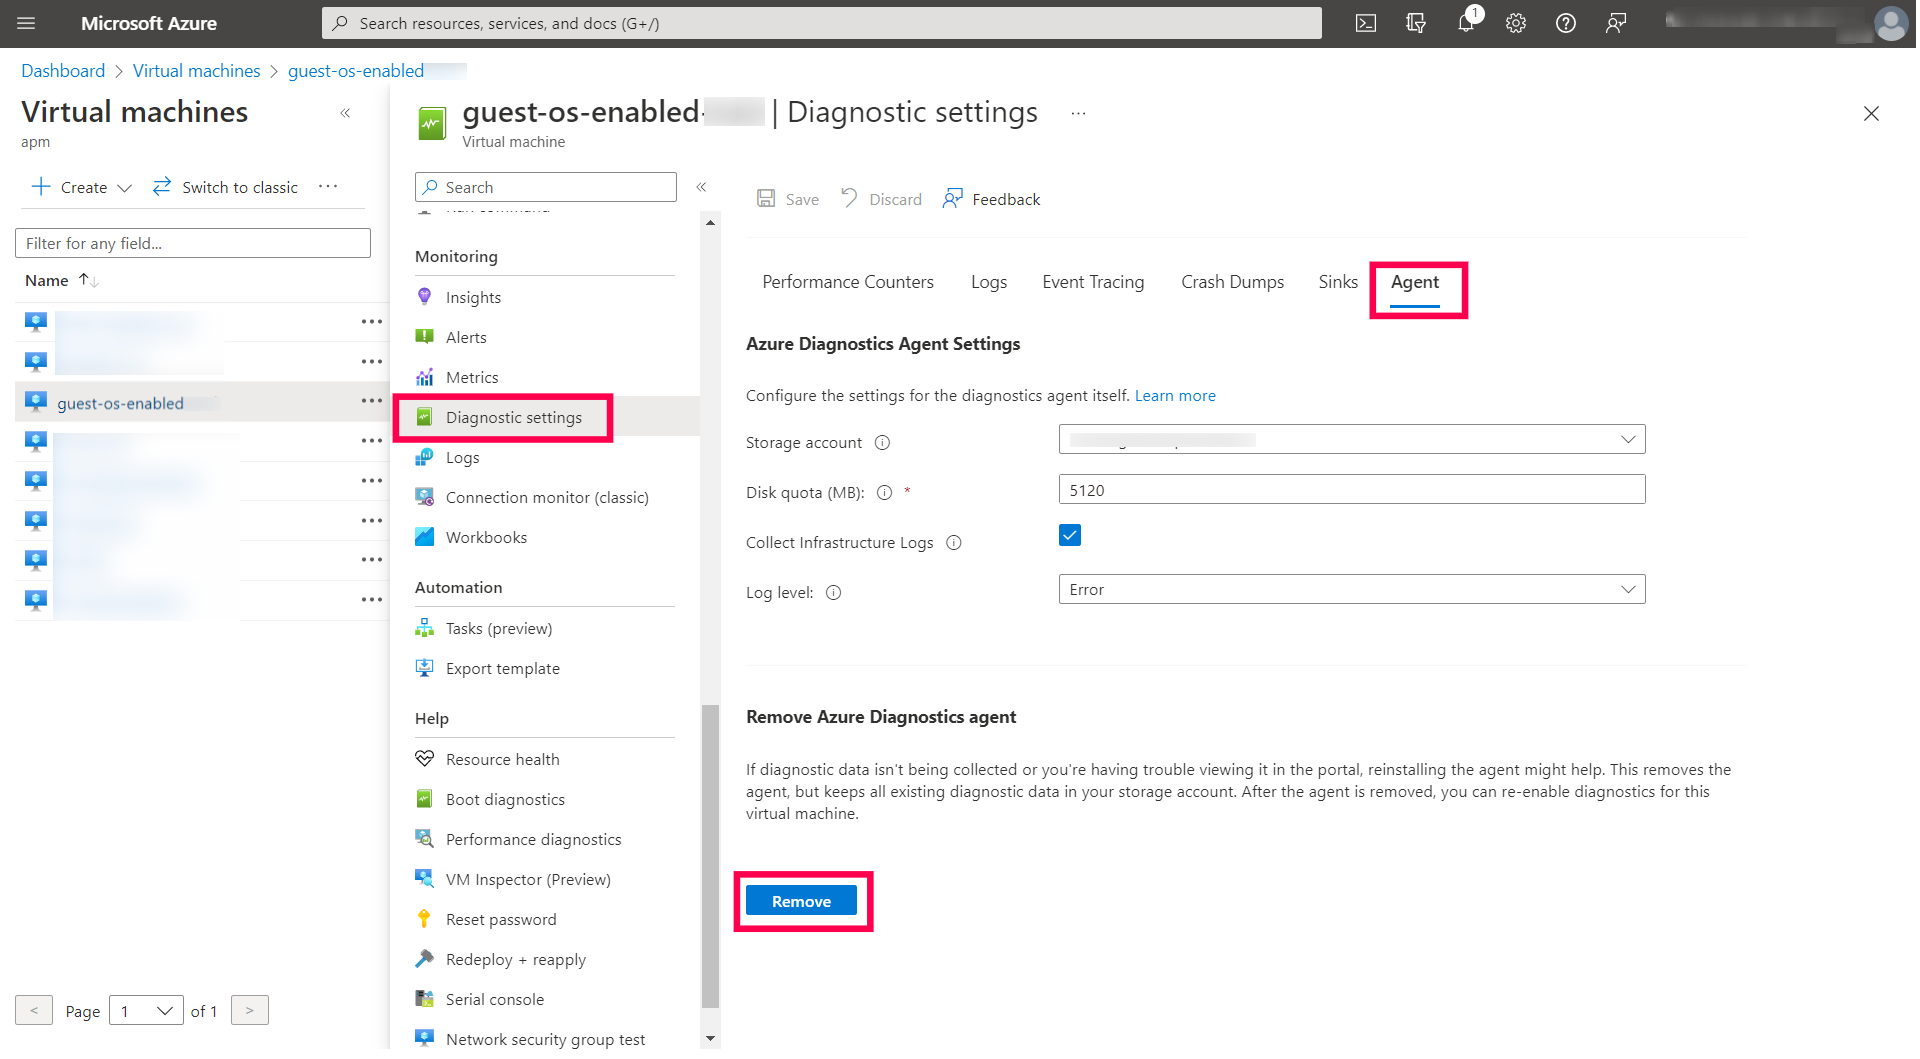
4. On the same page, now choose a diagnostics storage account from the dropdown and then click 'Enable guest-level monitoring' to enable the VM diagnostic.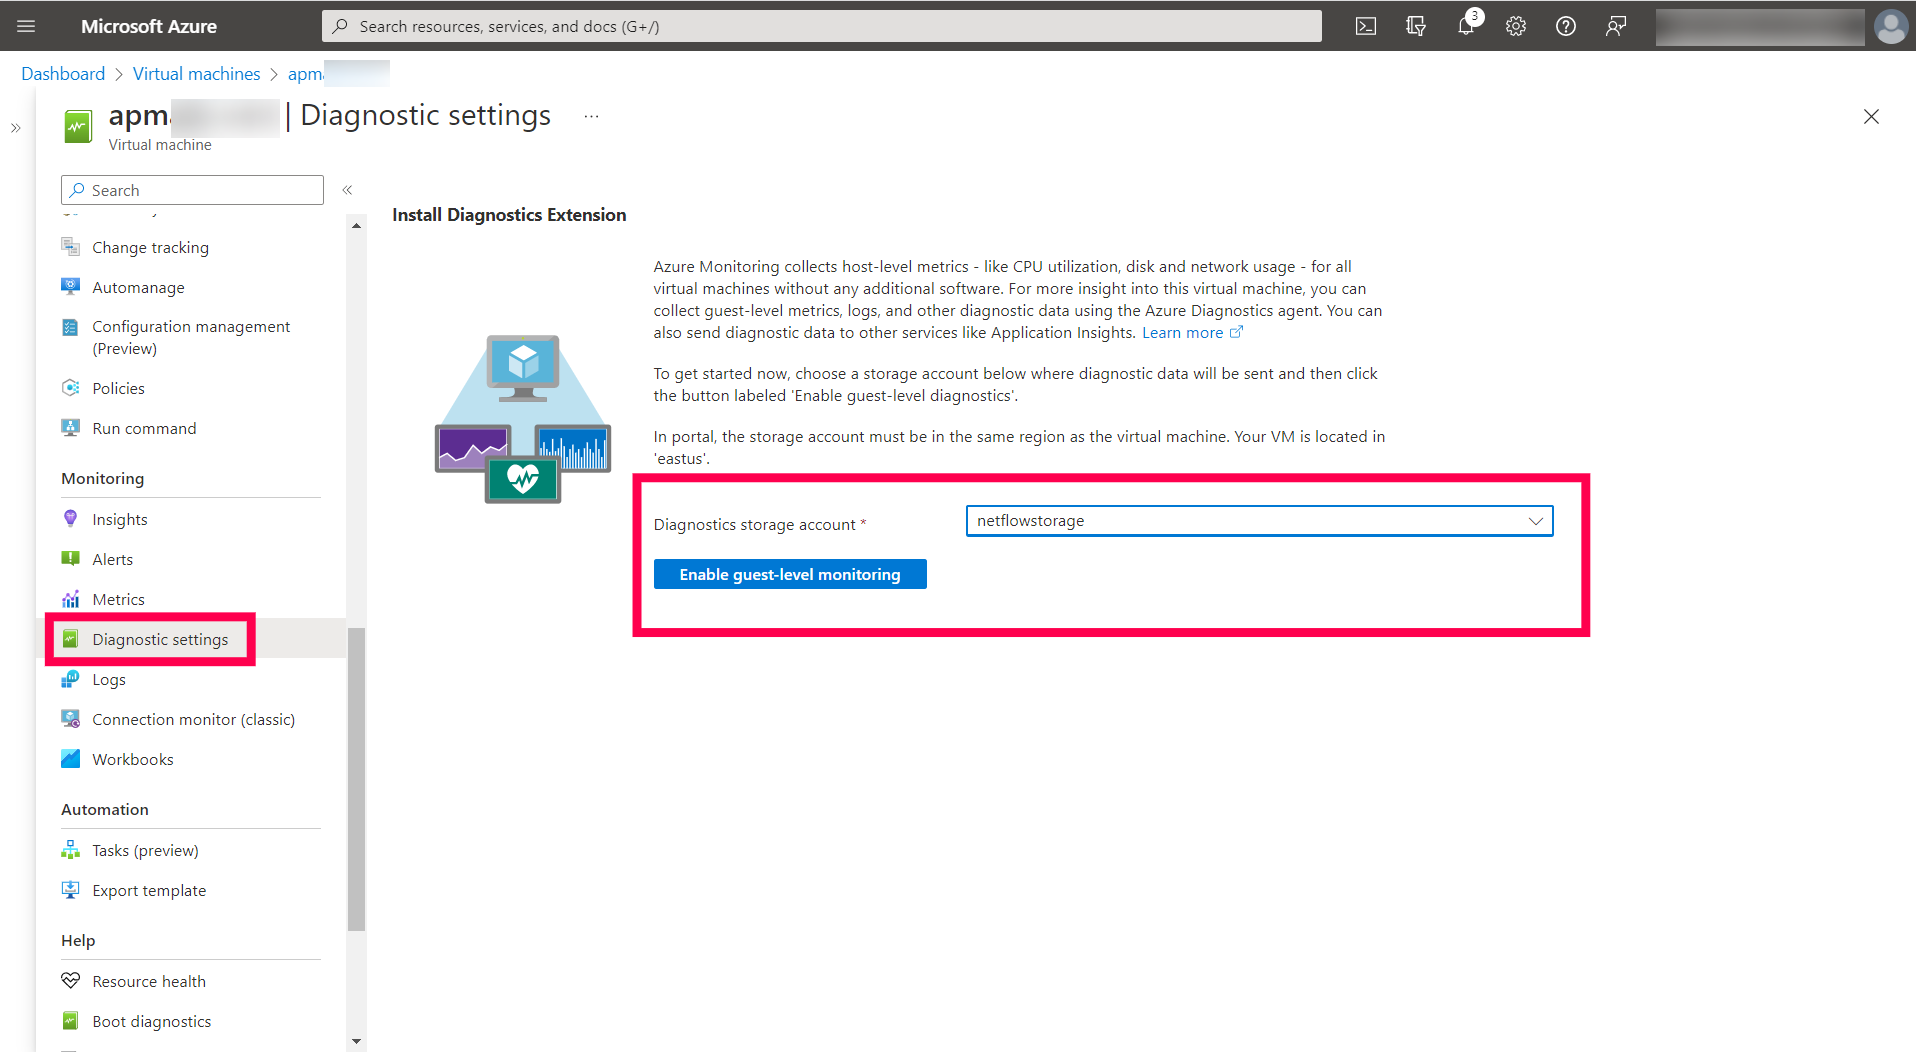
5. In Performance counters tab, all the Basic metrics are chosen by default, and the metrics monitored in Applications Manager are included in it. If the user wants to enable diagnostics only for the monitored metrics, select Custom and select the below-listed metrics and Save.
|
Metric Name in Azure Portal |
Metric Name in AppManager |
|
\\Processor Information(_Total)\\% User Time |
User Time |
|
\\Processor Information(_Total)\\% Privileged Time |
Privileged Time |
|
\\Processor Information(_Total)\\Processor Frequency |
Processor Frequency |
|
\\System\\Processes |
Process Count |
|
\\System\\Context Switches/sec |
Context Switches/sec |
|
\\Process(_Total)\\Thread Count |
Thread Count |
|
\\Process(_Total)\\Handle Count |
Handle Count |
|
\\Memory\\Committed Bytes |
Committed Bytes |
|
\\Memory\\Available Bytes |
Available Bytes |
|
\\Memory\\% Committed Bytes In Use |
Committed Bytes In Use |
|
\\Memory\\Page Faults/sec |
Page Faults/sec |
|
\\Memory\\Pool Paged Bytes |
Pool Paged Bytes |
|
\\Memory\\Pool Nonpaged Bytes |
Pool Nonpaged Bytes |
6. Restart the VM.
Steps to Enable Diagnostics Extension for Linux VMs
2. Navigate to your virtual machine.
3. Click on 'Diagnostics settings' on the vertical pane under 'Monitoring'.
4. To uninstall the old diagnostic agent and reinstall again, go to 'Agent' and click 'Remove' to remove the current diagnostic agent. On the same page, now choose a storage account from the dropdown and then click 'Enable guest-level monitoring' to enable the VM diagnostic.
5. To reduce the amount of data stored in Storage Account tables, configure only the required diagnostics instead of all.
Once the diagnostic settings are updated successfully, in the same pane, click 'Metrics' and then click 'Custom' and remove the unwanted metrics. Refer to the below image to view the required metrics and their configuration. Also, set the aggregation intervals to 1 minute (Choose only 'PT1M' and remove other intervals like 'PT1H', 'PT5M', etc.) and finally click 'Save' to save the configuration.
 Note:
Note: * In Applications Manager, we retrieve the VM diagnostics only from the PT1M tables.
* Configuring only the required metrics and setting the aggregation to 1 minute is mainly to reduce your Azure Storage cost by avoiding unwanted storage. In addition, it removes the old tables from the configured Storage Account to minimize the Storage cost.
| Metric Name in Azure Portal |
Metric Name in AppManager |
| /builtin/disk/averagereadtime | Average Read Time |
| /builtin/disk/averagewritetime | Average Write Time |
| /builtin/memory/availablememory | Available Memory (MB) |
| /builtin/memory/percentusedswap | Used Swap memory (%) |
| /builtin/memory/usedmemory | Used Memory (MB) |
| /builtin/memory/percentavailablememory | Available Memory (%) |
| /builtin/processor/percentidletime | Idle Time |
| /builtin/processor/percentiowaittime | IO Wait Time |
| /builtin/processor/percentprocessortime | Processor Time(Linux) |
6. To check whether the diagnostic agent is working properly by storing the diagnostic metrics in the configured Storage Account:
- In the Azure portal, go to Virtual Machine and click 'Metrics' under 'Monitoring' in the left pane.
- Make sure the 'Scope' is pointing to the respective Virtual Machine and choose 'Guest (Classic)' in 'Metric Namespace' dropdown.
- Choose any one metric, let us check by choosing 'CPU idle time' in 'Metric' dropdown and check the data points for the current timestamp as below:
How Applications Manager collects performance metrics of Azure VMs?
Once diagnostics are enabled for VMs in the Azure portal, the diagnostics metrics will be stored in the specified storage account every 1 minute. But the diagnostics of the current minute will be logged in the storage account only after some x minutes. The minimum delay in logging might be 3 minutes (from our observation). In some scenarios, the logging time delay may increase.
By default, Applications Manager collects 10 minutes of delayed data. In order to configure a lesser time delay in Applications Manager, go to Settings > Performance polling > Optimize data collection > Choose 'Azure Virtual Machine' monitor > Provide the delay (in minutes). Applications Manager will start collecting data accordingly.
In case, if data is not available for the delay provided, then this means that the logging delay of the Azure setup is higher than the mentioned value.

New to ADSelfService Plus?
Related Articles
Microsoft Azure VM - Enabling Azure Monitor Agent for Windows & Linux VMs
Purpose of Diagnostics Agent and Azure Monitor Agent Additional metrics from Azure Virtual Machine can be fetched via Diagnostic Extensions (DE) or Azure Monitor Agent (AMA). In Diagnostic Extensions, data is pushed to Azure Storage Account to which ...Azure Virtual Machine - FAQ
1. How is data collection happening for Azure Virtual Machine monitors? Microsoft Azure monitor discovery modes in AppManager: AD Application mode Organizational Account mode OAuth mode Azure VM monitor - Data collection methods: Azure Monitor Azure ...Microsoft Azure VM - Windows - [Unable to perform data collection as Diagnostics Extension is not enabled for the Virtual Machine in Azure Portal], even though diagnostics is enabled.
Steps to be done on the Azure VM by remoting into it: Delete all the tsf files on the machine with the problem. They are located here: C:\WindowsAzure\Logs\Plugins\Microsoft.Azure.Diagnostics.IaaSDiagnostics<DiagnosticsVersion>\WAD0107\Tables ...Microsoft Azure - FAQ
1. What happens to the Azure monitor in Applications Manager when you delete any of the supported services from the Azure portal? When a resource is deleted in Azure portal, the monitor status depends on the 'Action on Deleted Resources' option. ...Installing Applications Manager in Microsoft Azure
Applications manager can be installed in Azure Virtual Machines in both Windows and Linux platforms. Applications Manager comes with bundled PostgreSQL. Installing Applications Manager in VM for Windows Go to Virtual Machines and create a "Windows" ...