DNS Query analytics
DNS Query Analytics
DNS analytics dashboard provides a network administrator with quick insights into the DNS and leased IP activity related to a particular domain or network segment. It helps in monitoring network usage, identifying potential issues, and understanding traffic patterns.
To access the domain analytics
- Select the Select the DNS menu from the menu bar along the left side of the screen.
- From the submenus that appear, choose Analytics.
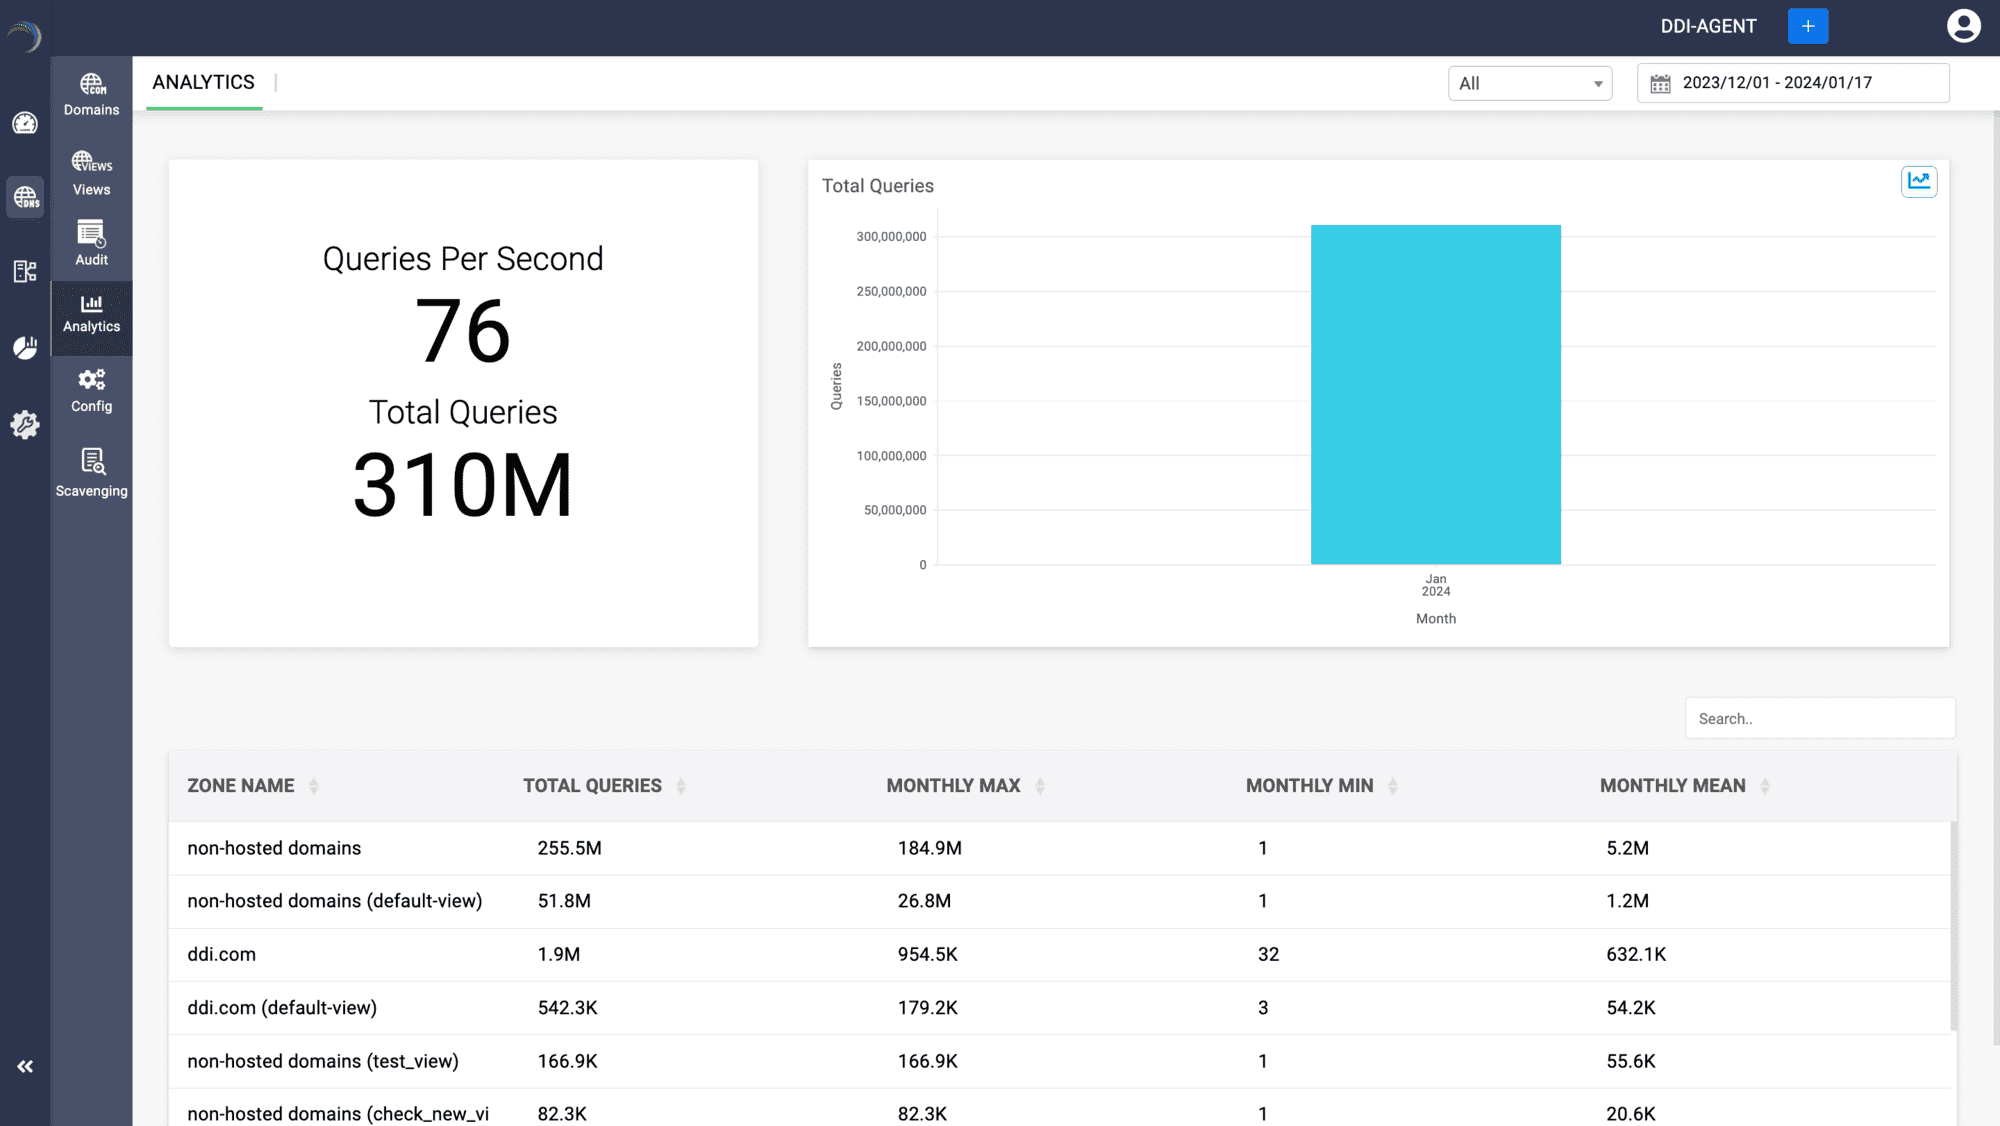
- The analytics page appears, showing the current query rate and the total queries handled by all the DNS servers in the cluster. At the top right corner of the analytics Page, choose the type of Zones to view the query analytics.
- All: Displays analytics for all domains.
- Hosted Domains: Shows analytics specifically for domains that are hosted.
- Blocked Domains: Presents analytics for domains that have been blocked.
Moreover, choose the required timeframe along which you want to analyze the performance of domains.
Queries Per Second: Indicates the current rate at which DNS queries are being processed by the server.
Total Queries: Displays the total volume of queries handled over a specific time period.
Below these metrics, you can find the query metrics for a list of Domains and Views. The list also bears the query volume for even the non-hosted- domains un-resolvable by your DNS servers.
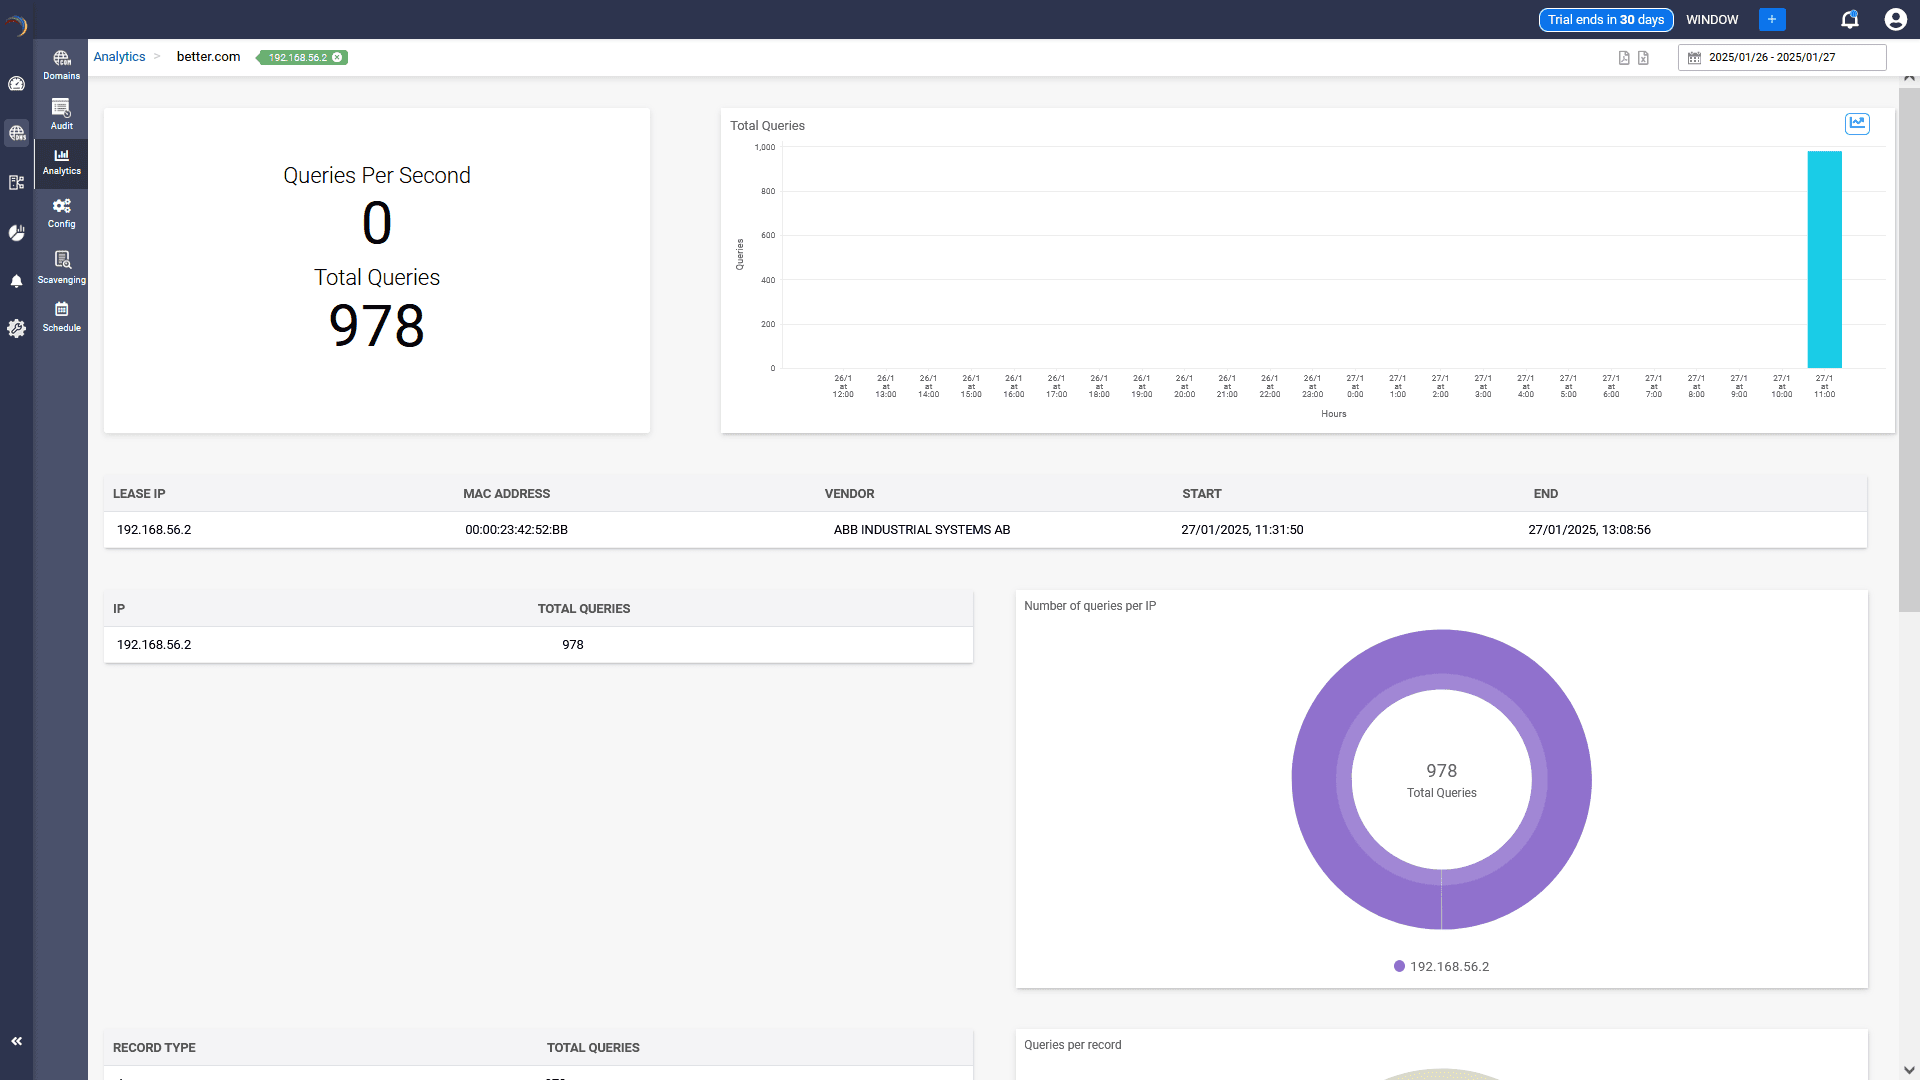
- To thoroughly evaluate a domain's performance, select a specific domain from the list. This will display the domain's specific performance metrics, including hourly query load over a user-defined timeframe.
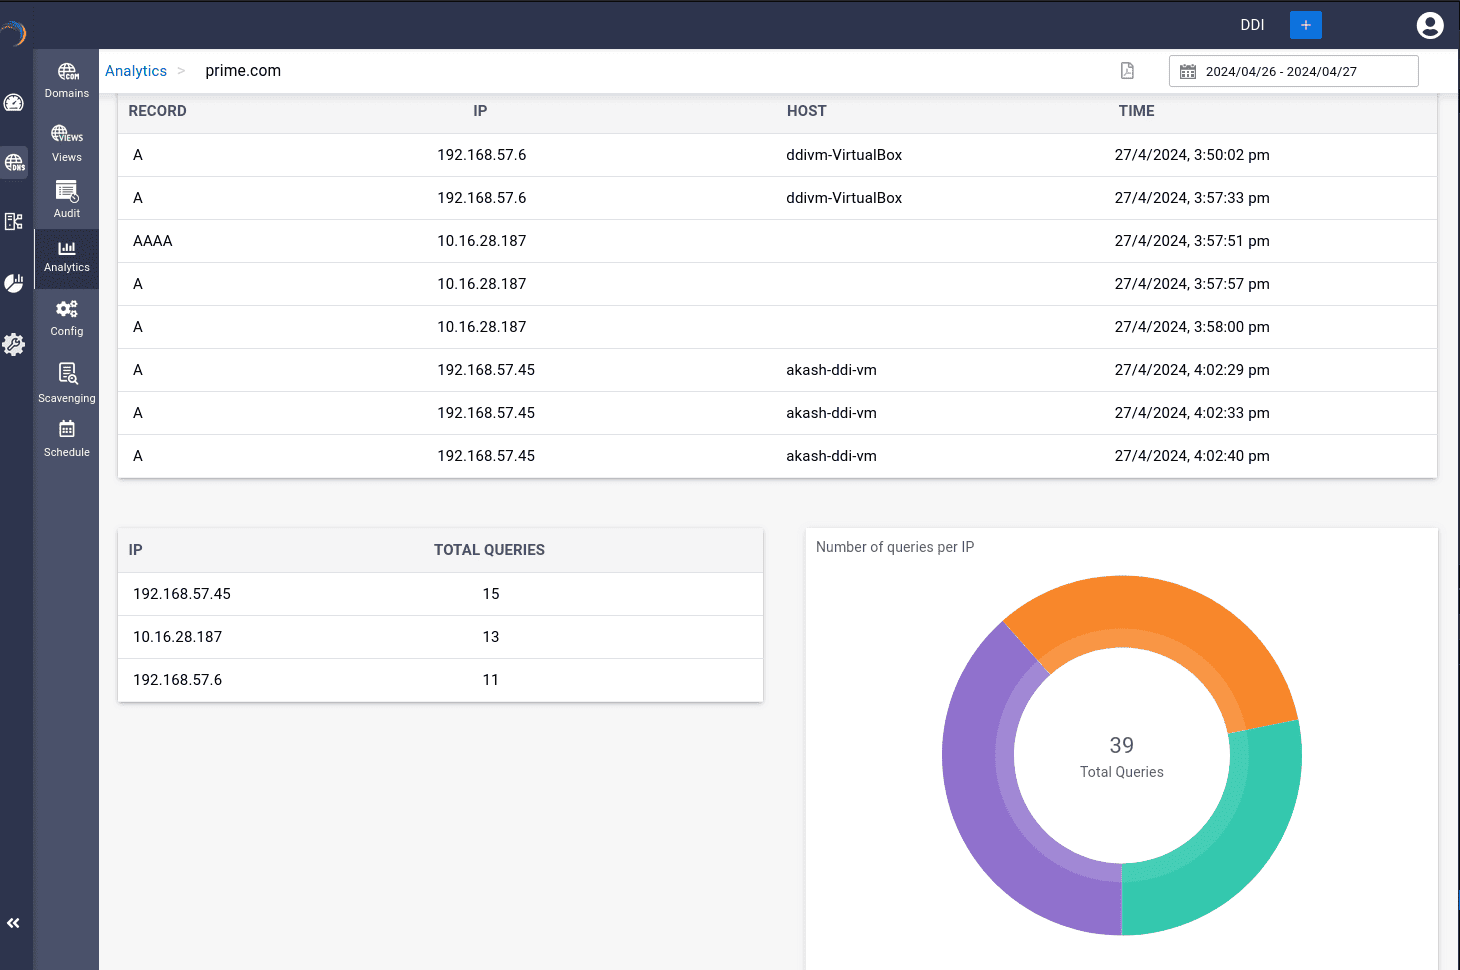
- You'll also see details for IP addresses leased under this domain, such as lease duration, MAC addresses identifying each host, and the vendors of the host machines.
- Additionally, the total query load across all IPs, as well as individual query loads, are visually represented in a doughnut chart accessible by selecting the respective IP.
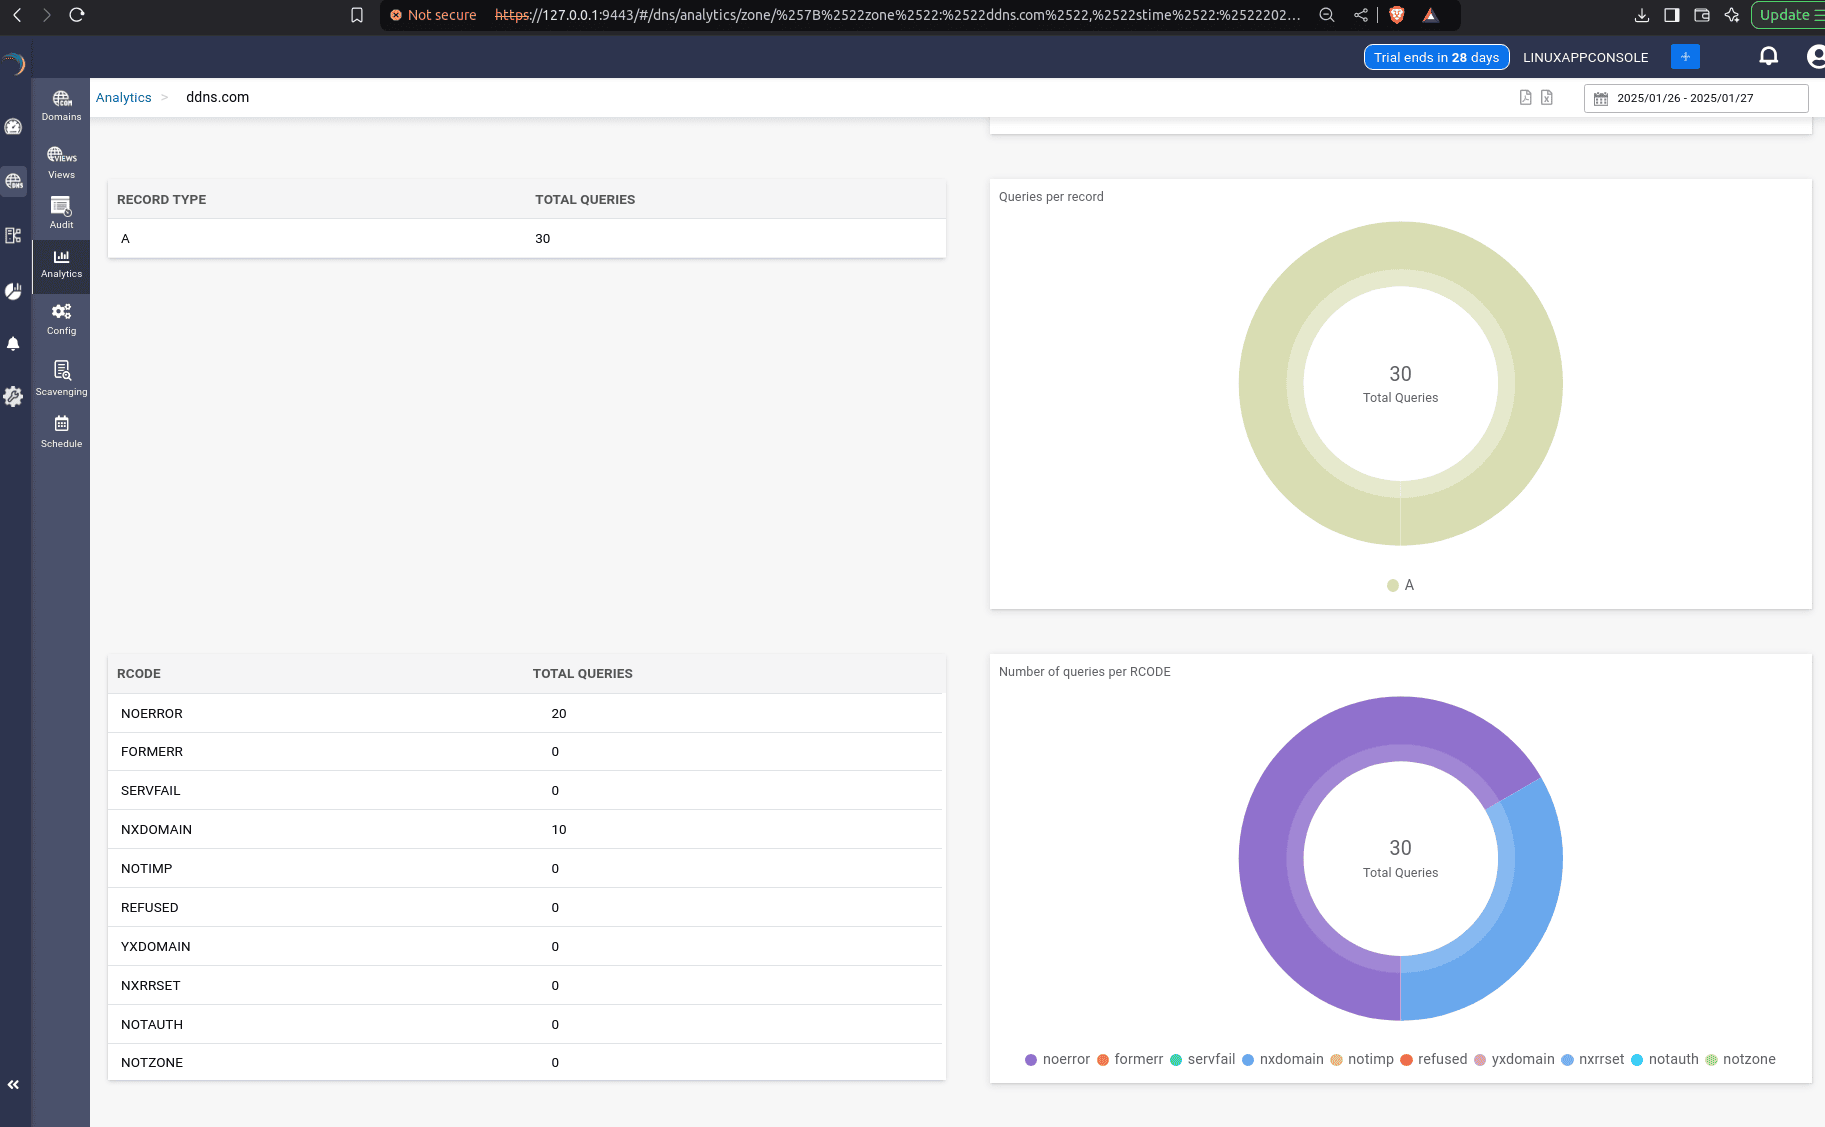
- Furthermore, a separate doughnut chart provides a visual breakdown of the query volume for different types of DNS records, illustrating the distribution for each query type.
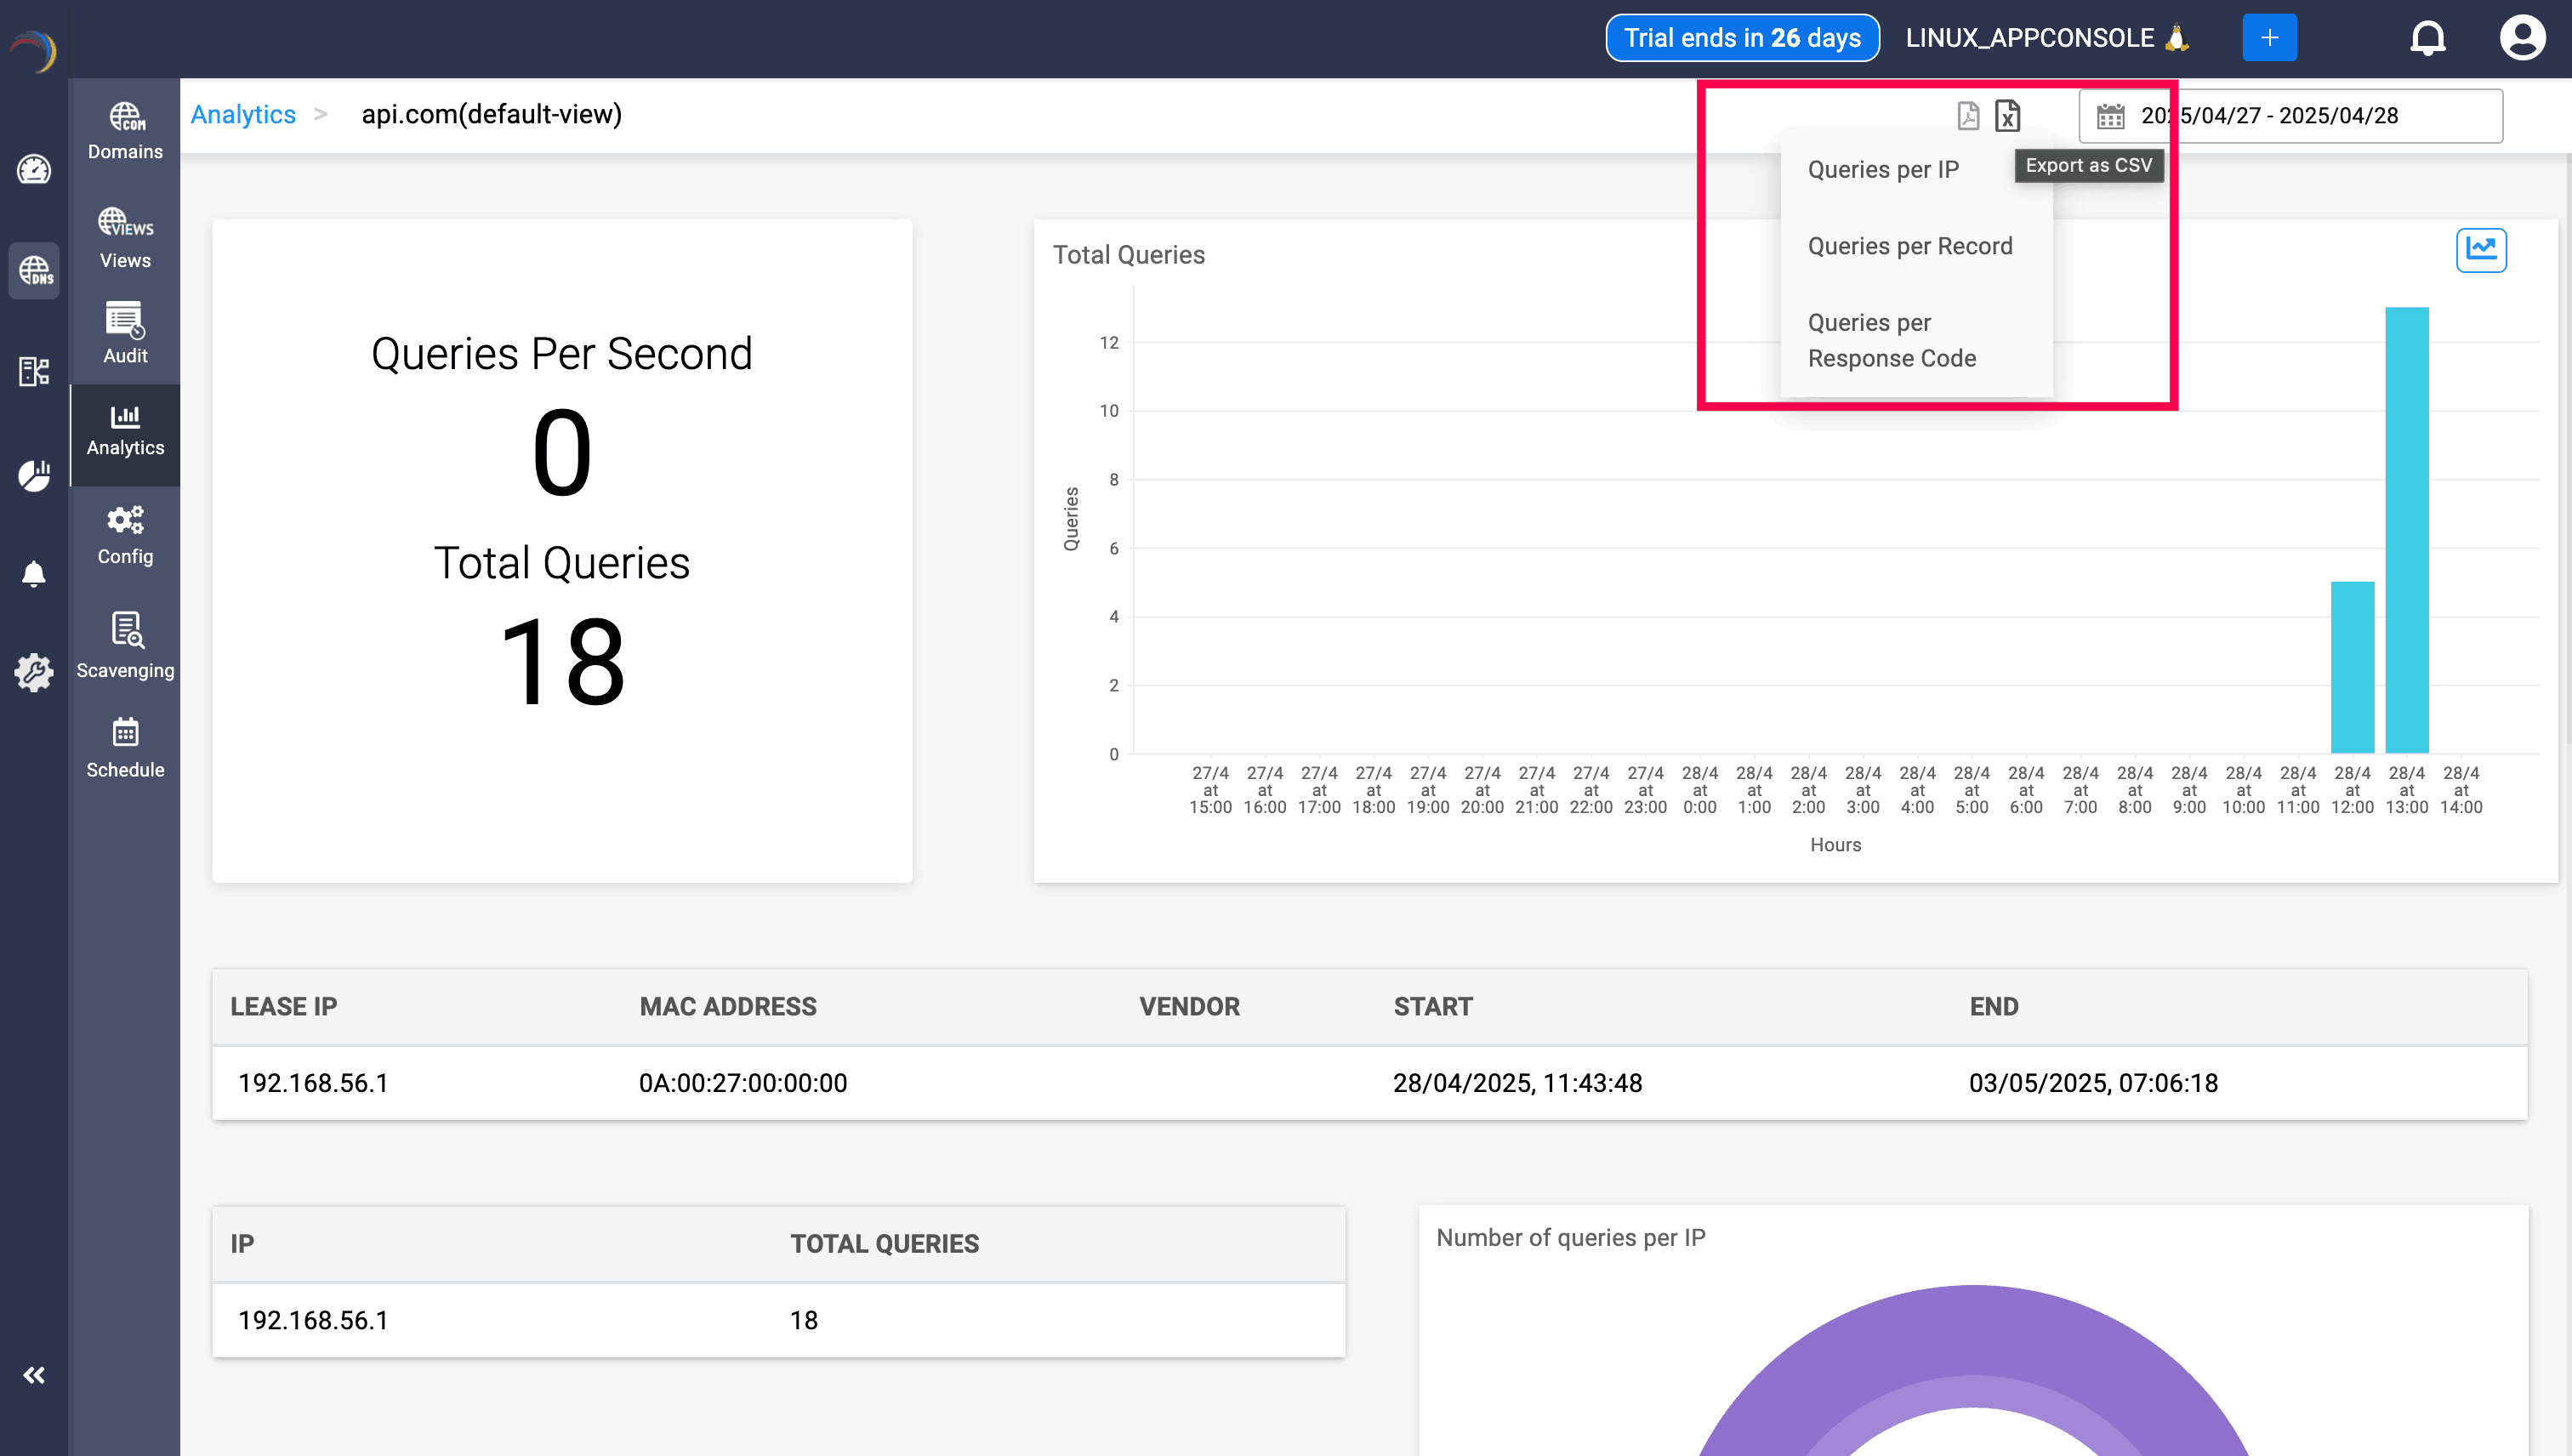
- You can also download the query data in CSV format by clicking on the Export as CSV icon. Here you have three different options for downloading query data:
- Queries per IP
- Queries per Record
- Queries per Response Code
- Clicking on a record type, such as A or AAAA, will display a comprehensive list of all the zones queried for that specific record type. This list includes the key performance indicators, such as hourly query load, queries per second, and the total number of queries covering the zones associated with the selected record type. Additionally, you can select a specific zone within the record type to drill down and view a visual summary of the query analytics pertaining to that zone's records.
- Scrolling down in the Analytics section provides a visual representation of response codes associated with the domain. This includes Graphical charts displaying the distribution of response codes and a tabular summary of each response code and the total number of queries.
-
Note: The Response Code analytics is only available for Hosted authoritative domains. For the blocked and non hosted domains, the response codes are not available.
- IP-Based Search: Enter a specific IP address to identify the domains it has queried and analyze the query statistics associated with that IP.

Blocked Domain analytics
- Each query made to a blocked domain from within your internal network infrastructure triggers an immediate email notification to the DDI Central administrators identifying the Host with their MAC address, Host name and the IP address of the host at that point of time.
- To access the blocked domain analytics directly from the DDI Central UI:
- Get into the DNS module, select Analytics menu.
- On the top right corner of the Analytics page,find a drop-down menu and select Blocked Domains from the list of options. This will display all the KPIs like Query per hour, and Hourly query volume.
- Select the blocked zone name of your choice. An analytics page on the selected zone appears on screen as shown below.
- Here, you can see who accessed what type of record pertaining to the blocked zone, with which IP, and specific details about their identity like their host name and the time of access. This way, the admin can quickly identify the host violating such network security policies. Also, DDI Central gives an overview of the list of IPs trying to reach the said blocked zones and a visual snapshot of the same to identify the major end users involved in security violations.
- To receive prompt email notification make sure the SMTP host has been configured under Settings-> SMTP->Configure SMTP.

New to ADSelfService Plus?
Related Articles
DNS query analytics
DNs analytics dashboard provides a network administrator with quick insights into the DNS and leased IP activity related to a particular domain or network segment. It helps in monitoring network usage, identifying potential issues, and understanding ...Microsoft Domain Query Analytics
DNS query analytics DNS analytics dashboard provides a network administrator with quick insights into the DNS and leased IP activity related to a particular domain or network segment. It helps in monitoring network usage, identifying potential ...Forecasting DNS Queries
DNS Query Forecasting Forecasting in DDI Central for DNS queries and DHCP leases allows network admins to forecast their organization network's DNS services performance by analyzing the historical data. These dashboards provide visual summarization ...DDI Central for Microsoft DNS DHCP
About ManageEngine DDI Central DDI Central is a comprehensive network management solution that unifies DNS, DHCP, and IP Address Management (IPAM) to enhance operational efficiency and network stability. It is deployed as an overlay on your existing ...DNS Firewall(FRW) Response Policy Zones (RPZ)
RPZ (Response Policy Zone) allows a nameserver to modify DNS responses based on policies. It's often used for implementing security measures, such as blocking known malicious domains, redirecting domains, or applying other customized policies. When a ...