Why average values of helpdesk KPIs don't give you the full story?
While measuring helpdesk KPIs such as resolution time and response time, we always look at the average value. An average resolution time of 5 hours tells you that your technicians take around 5 hours to provide end users with a resolution to their problem. Does that mean that ALL your technicians come up with a resolution in 5 hours? Not really.
Let's consider a 2 person helpdesk team with Adam and John as the helpdesk technicians.
Scenario 1- Adam resolves all requests within 4 hours (4 hour resolution time) and John resolves all requests in 6 hours (6 hour resolution time). The average resolution time is 5 hours.
Scenario 2- Adam resolves all requests within the first hour (1 hour resolution time) and John takes about 9 hours to resolve all his requests (9 hour resolution time). The average resolution time of the helpdesk is still 5 hours.
See the problem? The fact that John takes too long to resolve requests ( in our scenario 2) goes unnoticed because the average resolution time is under control. And that is mostly because Adam is probably working too hard and pulling most of the weight. How do you spot these irregularities in your helpdesk?
Introducing Standard Deviation. Yes, that boring concept you probably skipped in elementary school. Standard deviation can give you the measure by which your individual values are spread. Ok let's be honest, statistical concepts can be boring sometimes most of the time. All you need to remember is this-
1. Lower standard deviation values are better.
2. Low standard deviation indicates that your individual values are not spread across by a large degree.
In our example, scenario 1 will have a lower standard deviation compared to scenario 2.
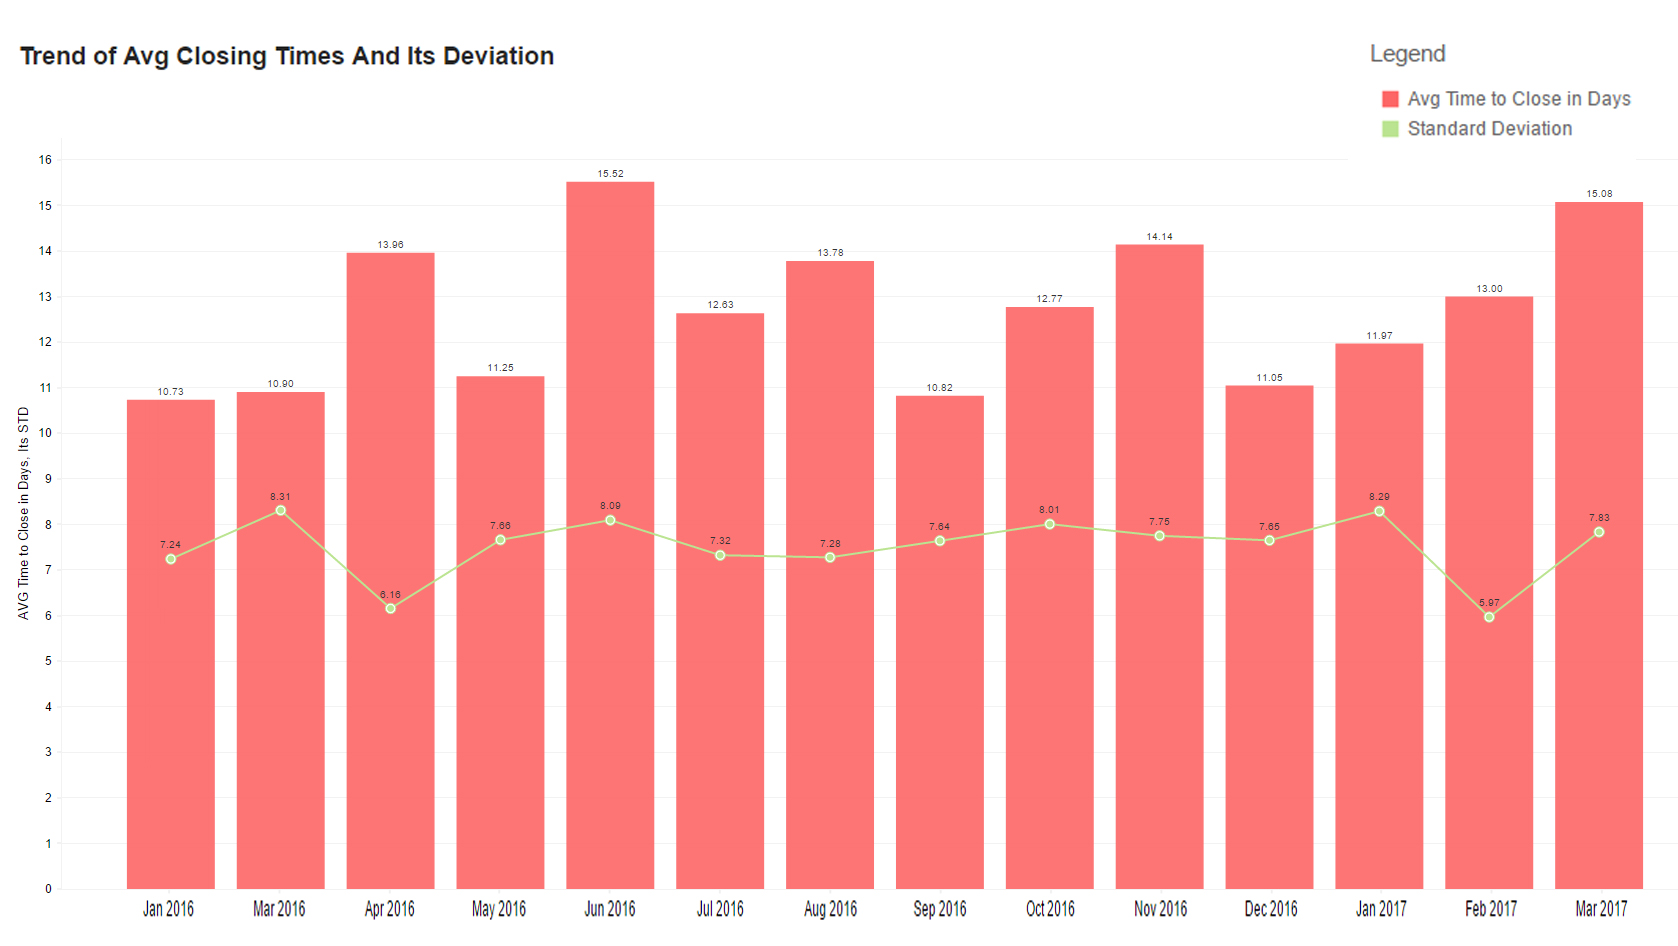
Analytics Plus offers reports such as the Trend of Avg Closing Times and its Deviation for ServiceDesk Plus that not only gives you a trend of average closure time but also the standard deviation in closing time for each of those months. Average values coupled with standard deviation add a lot of value. And of course, you can create similar reports for the other KPIs to spot irregularities.
Click here for the live report.

Topic Participants
Rakesh
New to M365 Manager Plus?
New to M365 Manager Plus?
New to RecoveryManager Plus?
New to RecoveryManager Plus?
New to Exchange Reporter Plus?
New to Exchange Reporter Plus?
New to SharePoint Manager Plus?
New to SharePoint Manager Plus?
New to ADManager Plus?