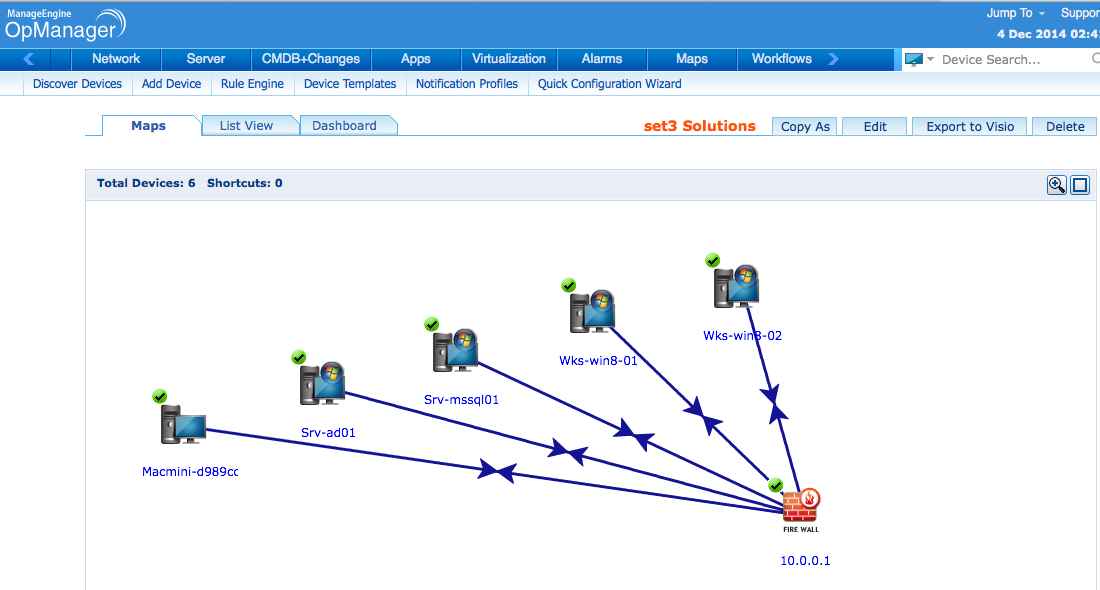
We were also taking a look at their ManageEngine OpManager installation and we had managed to create the basis for some great monitoring dashboards to help them review the status of their network at a glance. Using Business Views and dynamic link monitoring, where the status of the line indicates current link bandwidth and link status of key site links, was of particular interest:
Now ManageEngine OpManger has a neat type of display called the CCTV View. With this view you can setup a series of OpManager dashboards you want to cycle through on a timed basis in a single pop-up window, great for those 'heads up' plasma displays!
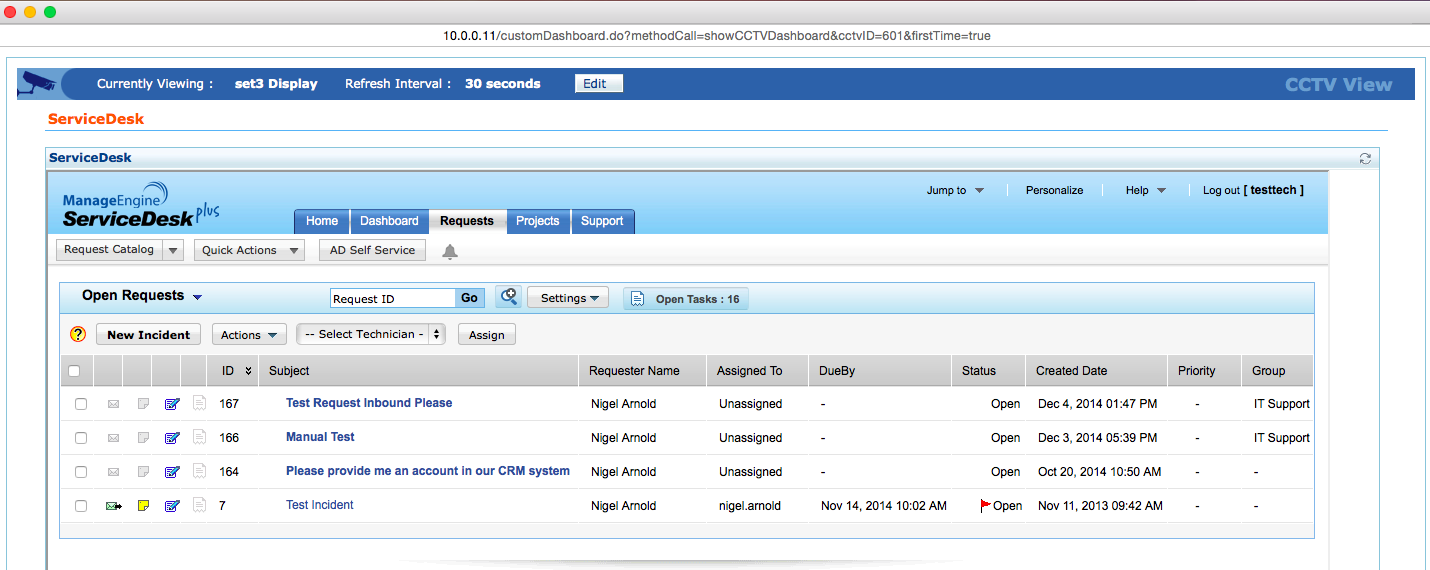
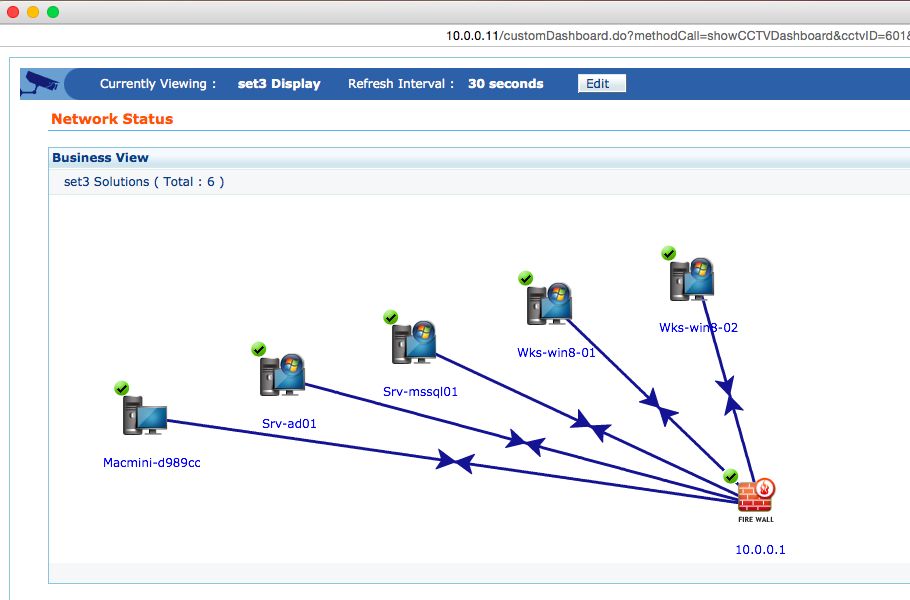
What our client wanted to know was could we have a CCTV view that showed a network status Business View followed by a view of the current ManageEngine ServiceDesk Plus open requests queue. Turns out all you need to do is create a new dashboard view in ManageEngine OpManager that has a Custom HTML or Text widget created on it, here's the 'Add Widget' option of an OpManager dashboard:
When you view the dashboard with this widget you get to modify the parameters of the widget and add some custom HTML code:
You should notice we've used an iFrame container with a couple of sizing elements to allow us to display the URL of our ServiceDesk installation within the custom HTML widget; we've used the extension 'WOListView.do' just to ensure SDPlus defaults to the Request tab in the display. Don't forget to replace the IP address and port shown with details of your ServiceDesk Plus server hostname/IP and port number.
Now as long as you login to the ManageEngine ServiceDesk Plus GUI that is shown via this widget on the OpManager Business View and navigate to the information you want to see this will display in the CCTV view on the time limited you specified, my CCTV view cycles through SD+ and our visual network map:
We hope you find this useful?
Best Regards
set3 Solutions
ManageEngine Partner


