[ Release update] Release announcement: Build 4000
Hello folks!
We're happy to roll out Analytics Plus build 4000 that comes power-packed with whole lot of features and updates.
1. Revamped home page UI
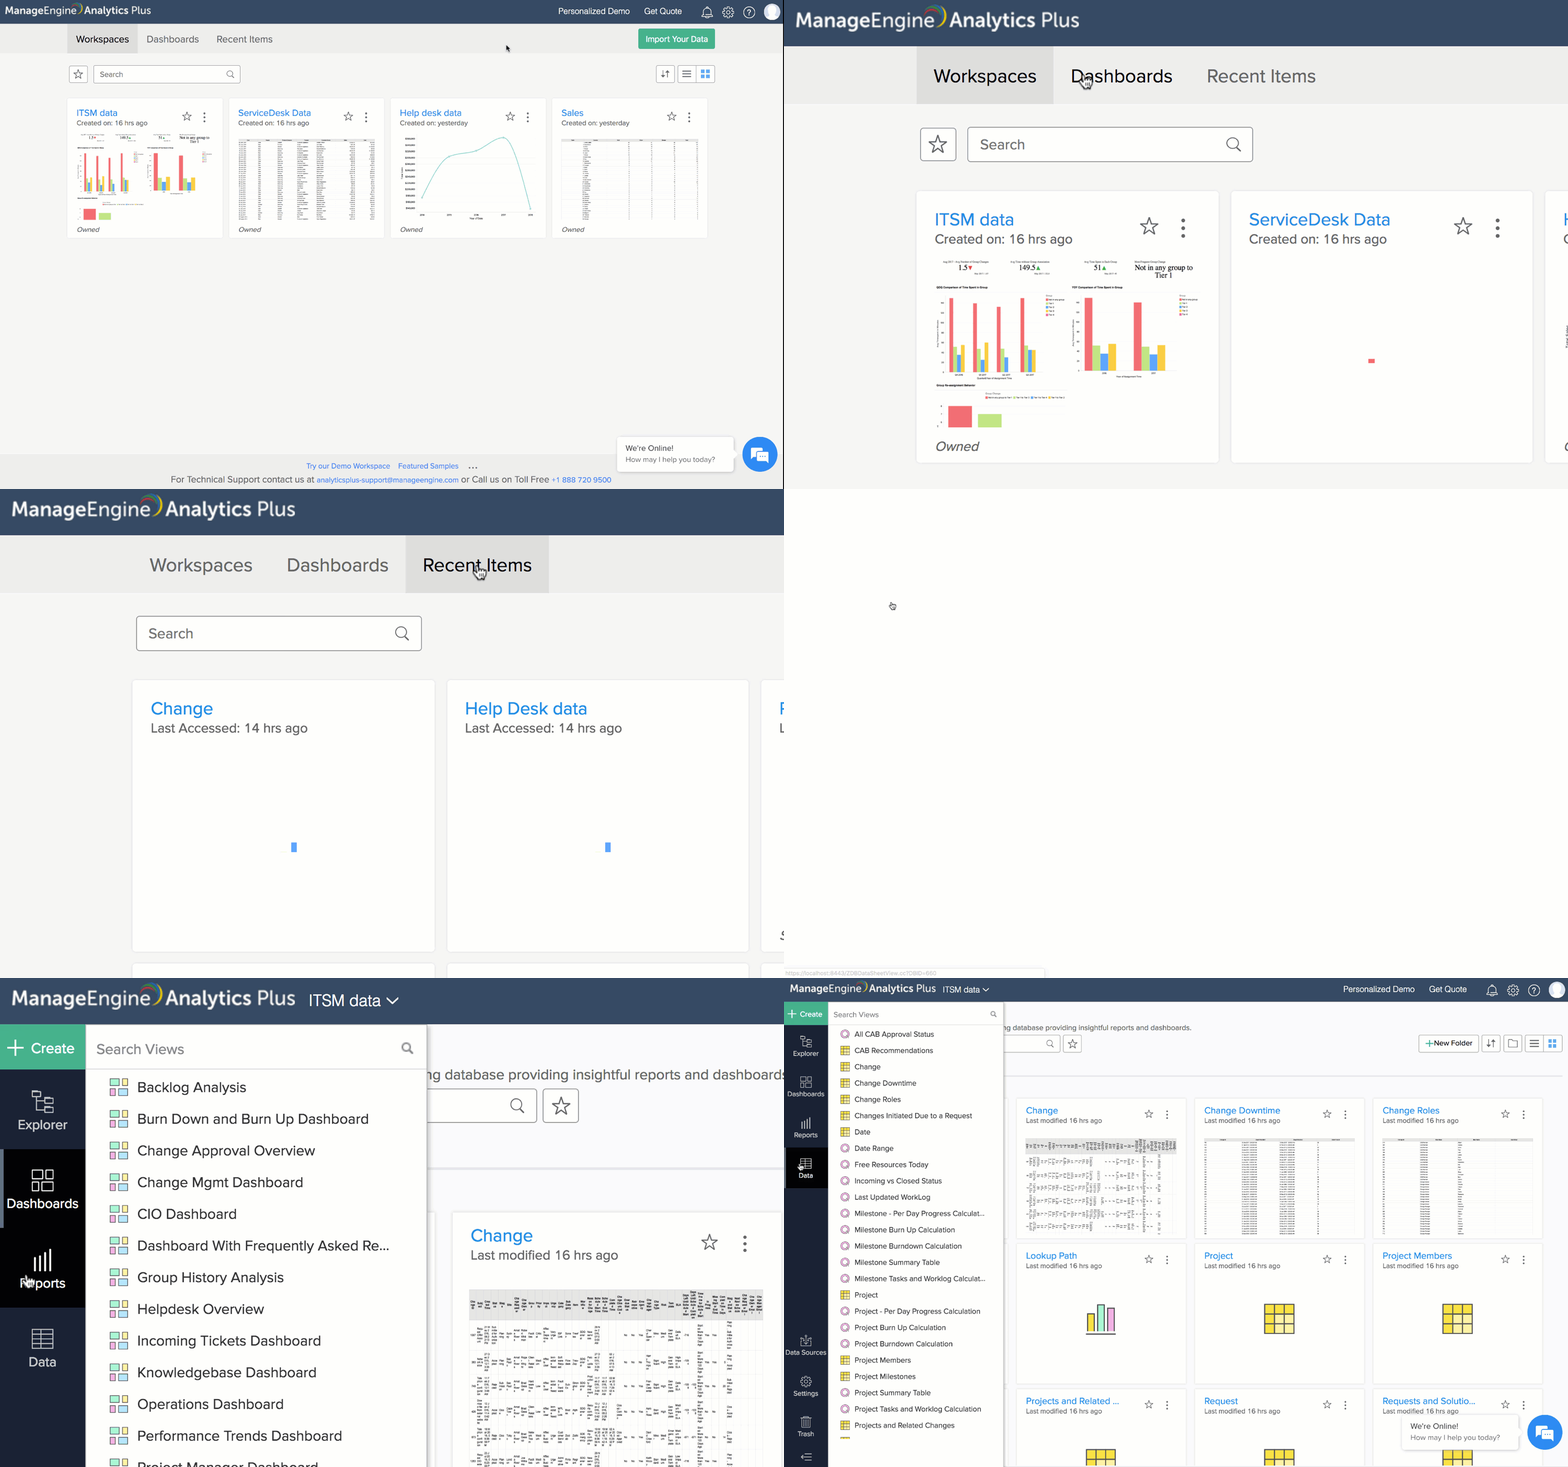
The Analytics Plus home page has been completely revamped for easy navigation.
- The main navigational elements are bigger and bolder.
- The various workspace elements are organized into 'Reports', 'Dashboards', and 'Data' to give you easy access to your data.
2. Introducing report commenting
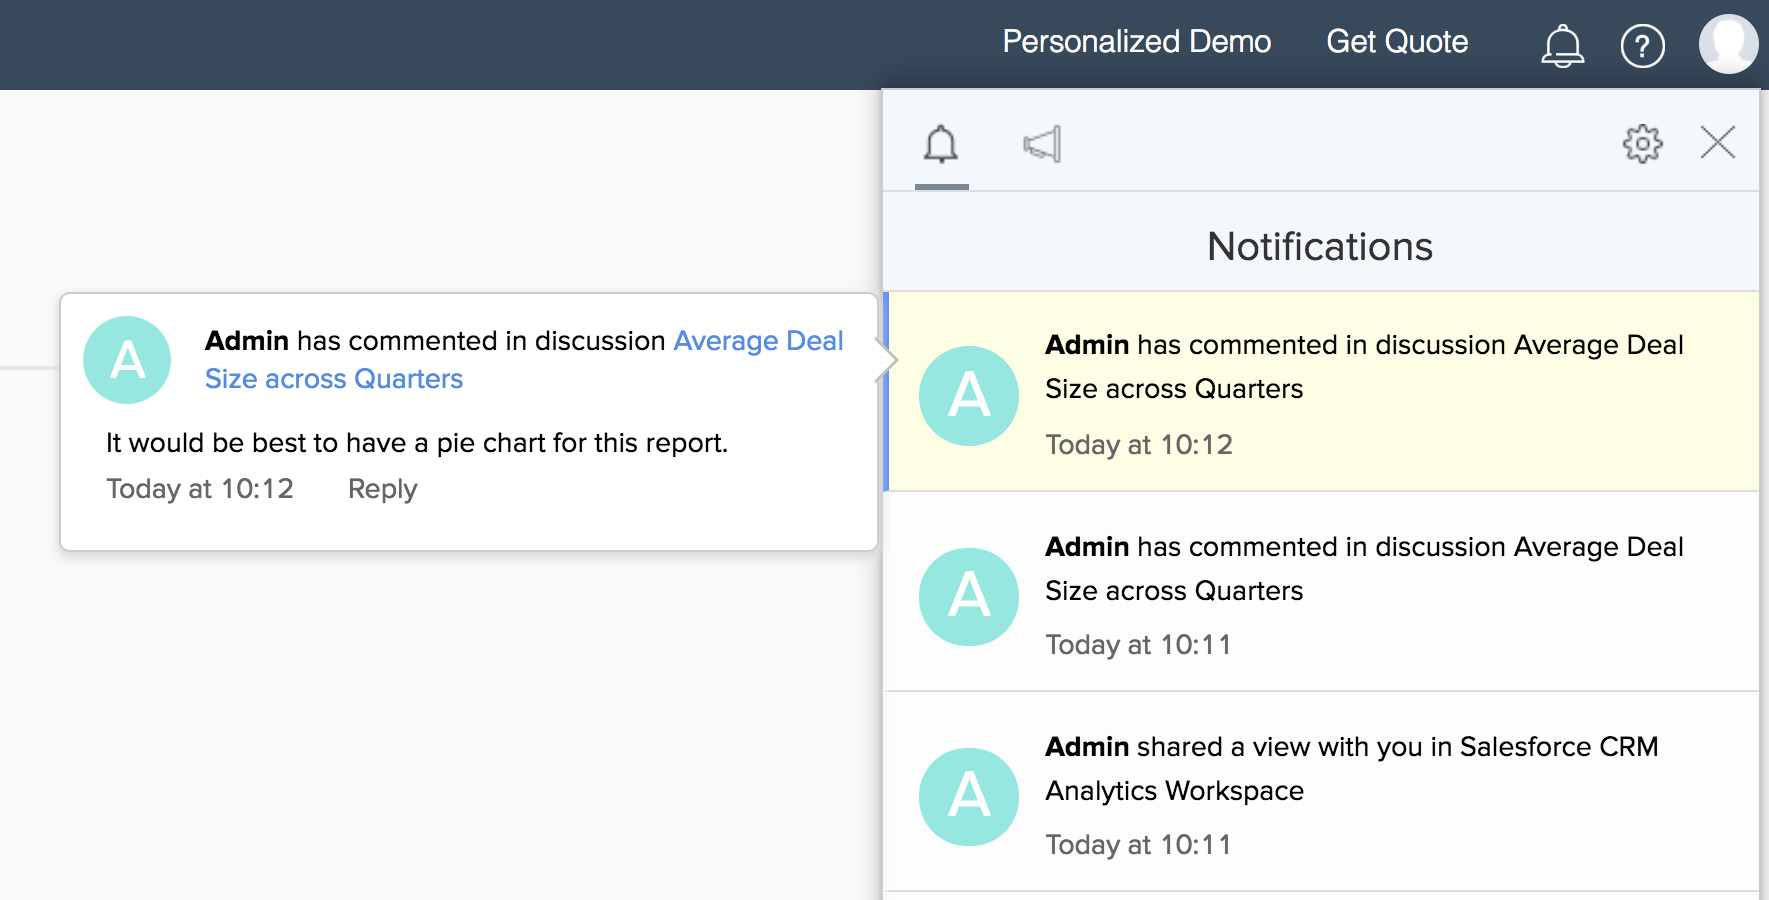
With the new update, you can insert comments in your reports and reach consensus with your team regarding key metrics without ever leaving the Analytics Plus console. Shared users will be able to view the comments by clicking the in-app notifications.
Note:
Users can view comments or receive notifications only for reports that are shared with them.
3. Import data from cloud drives
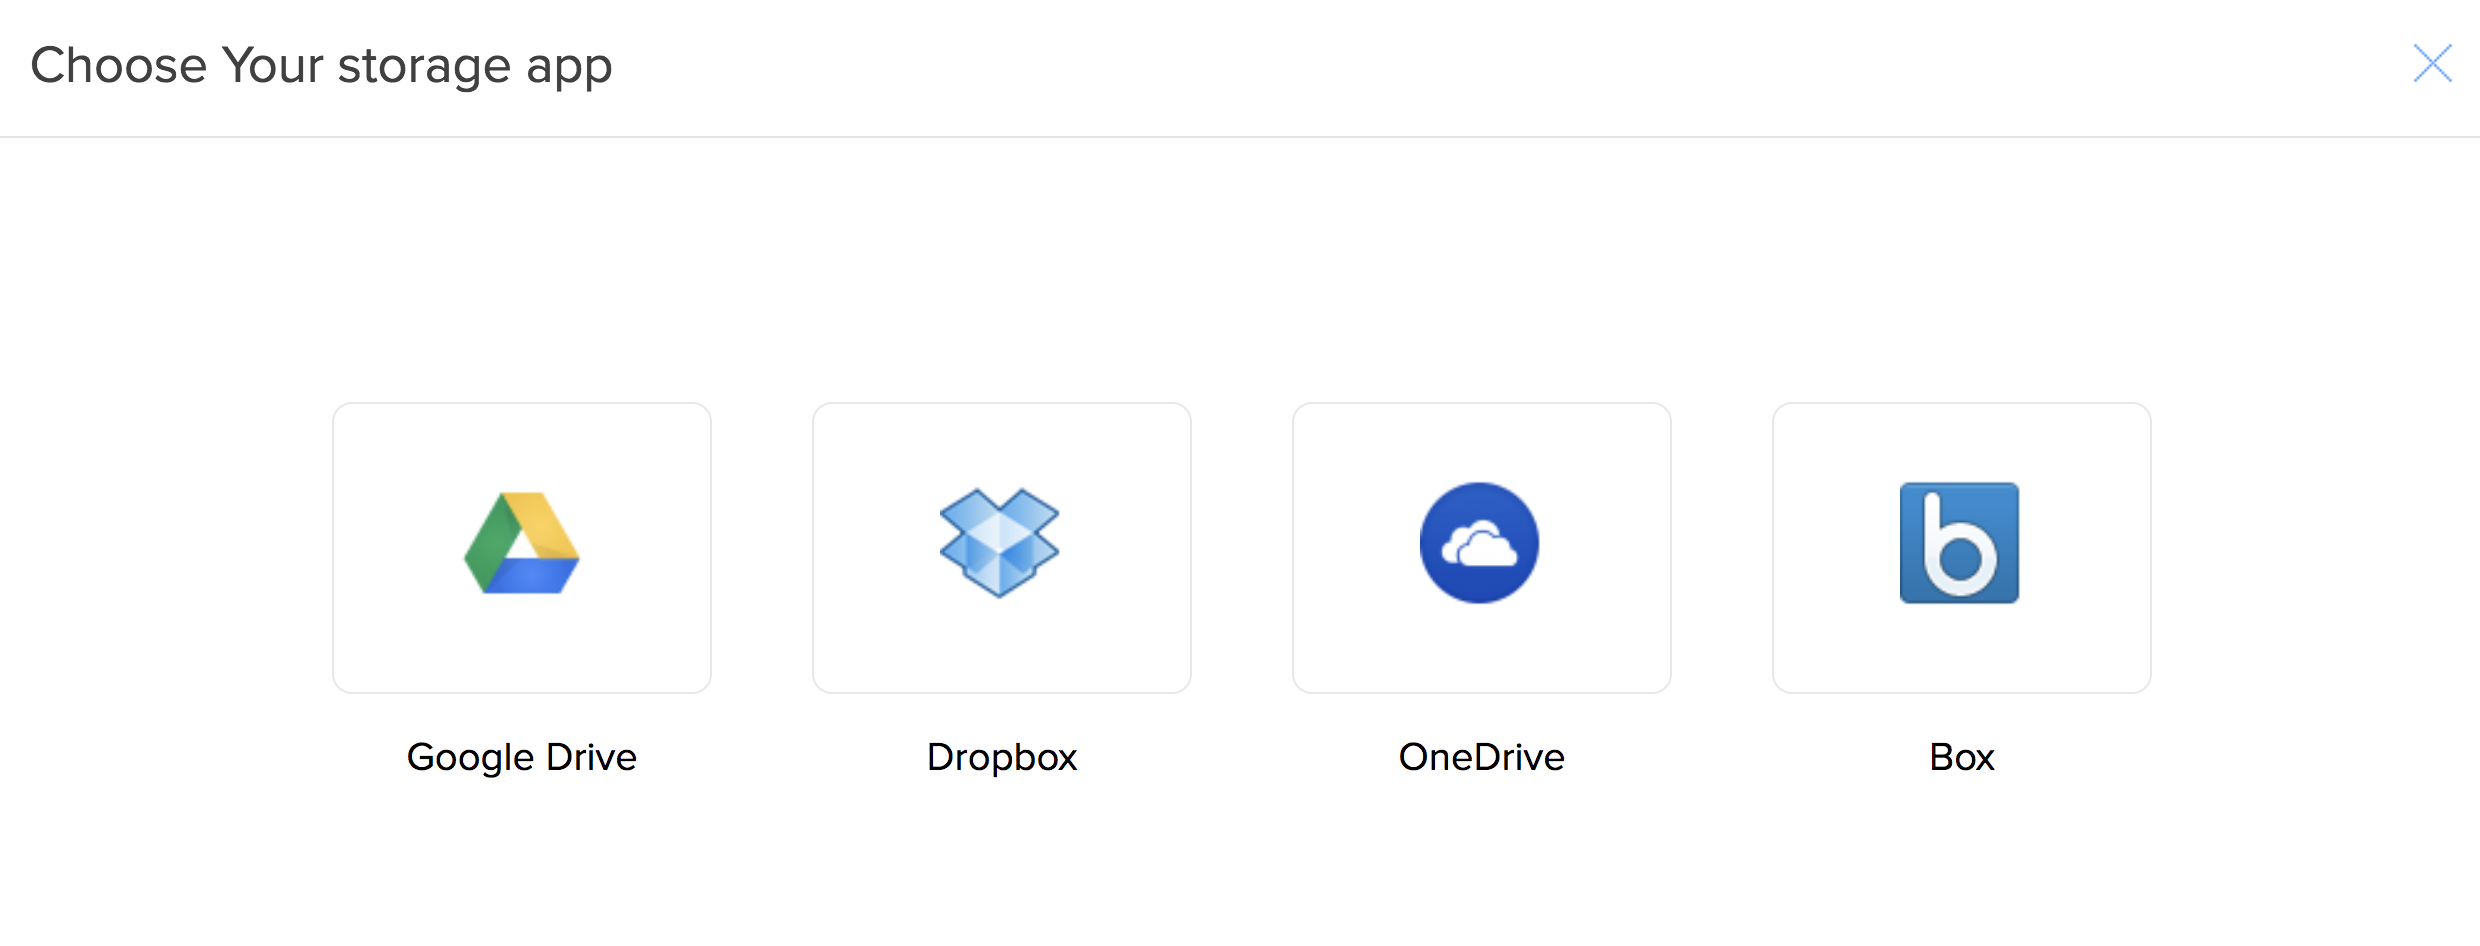
Got ITSM data in cloud drives? The new update offers seamless data import from cloud sources like Box, Dropbox, Google Drive, and One Drive, for faster analysis and reporting.
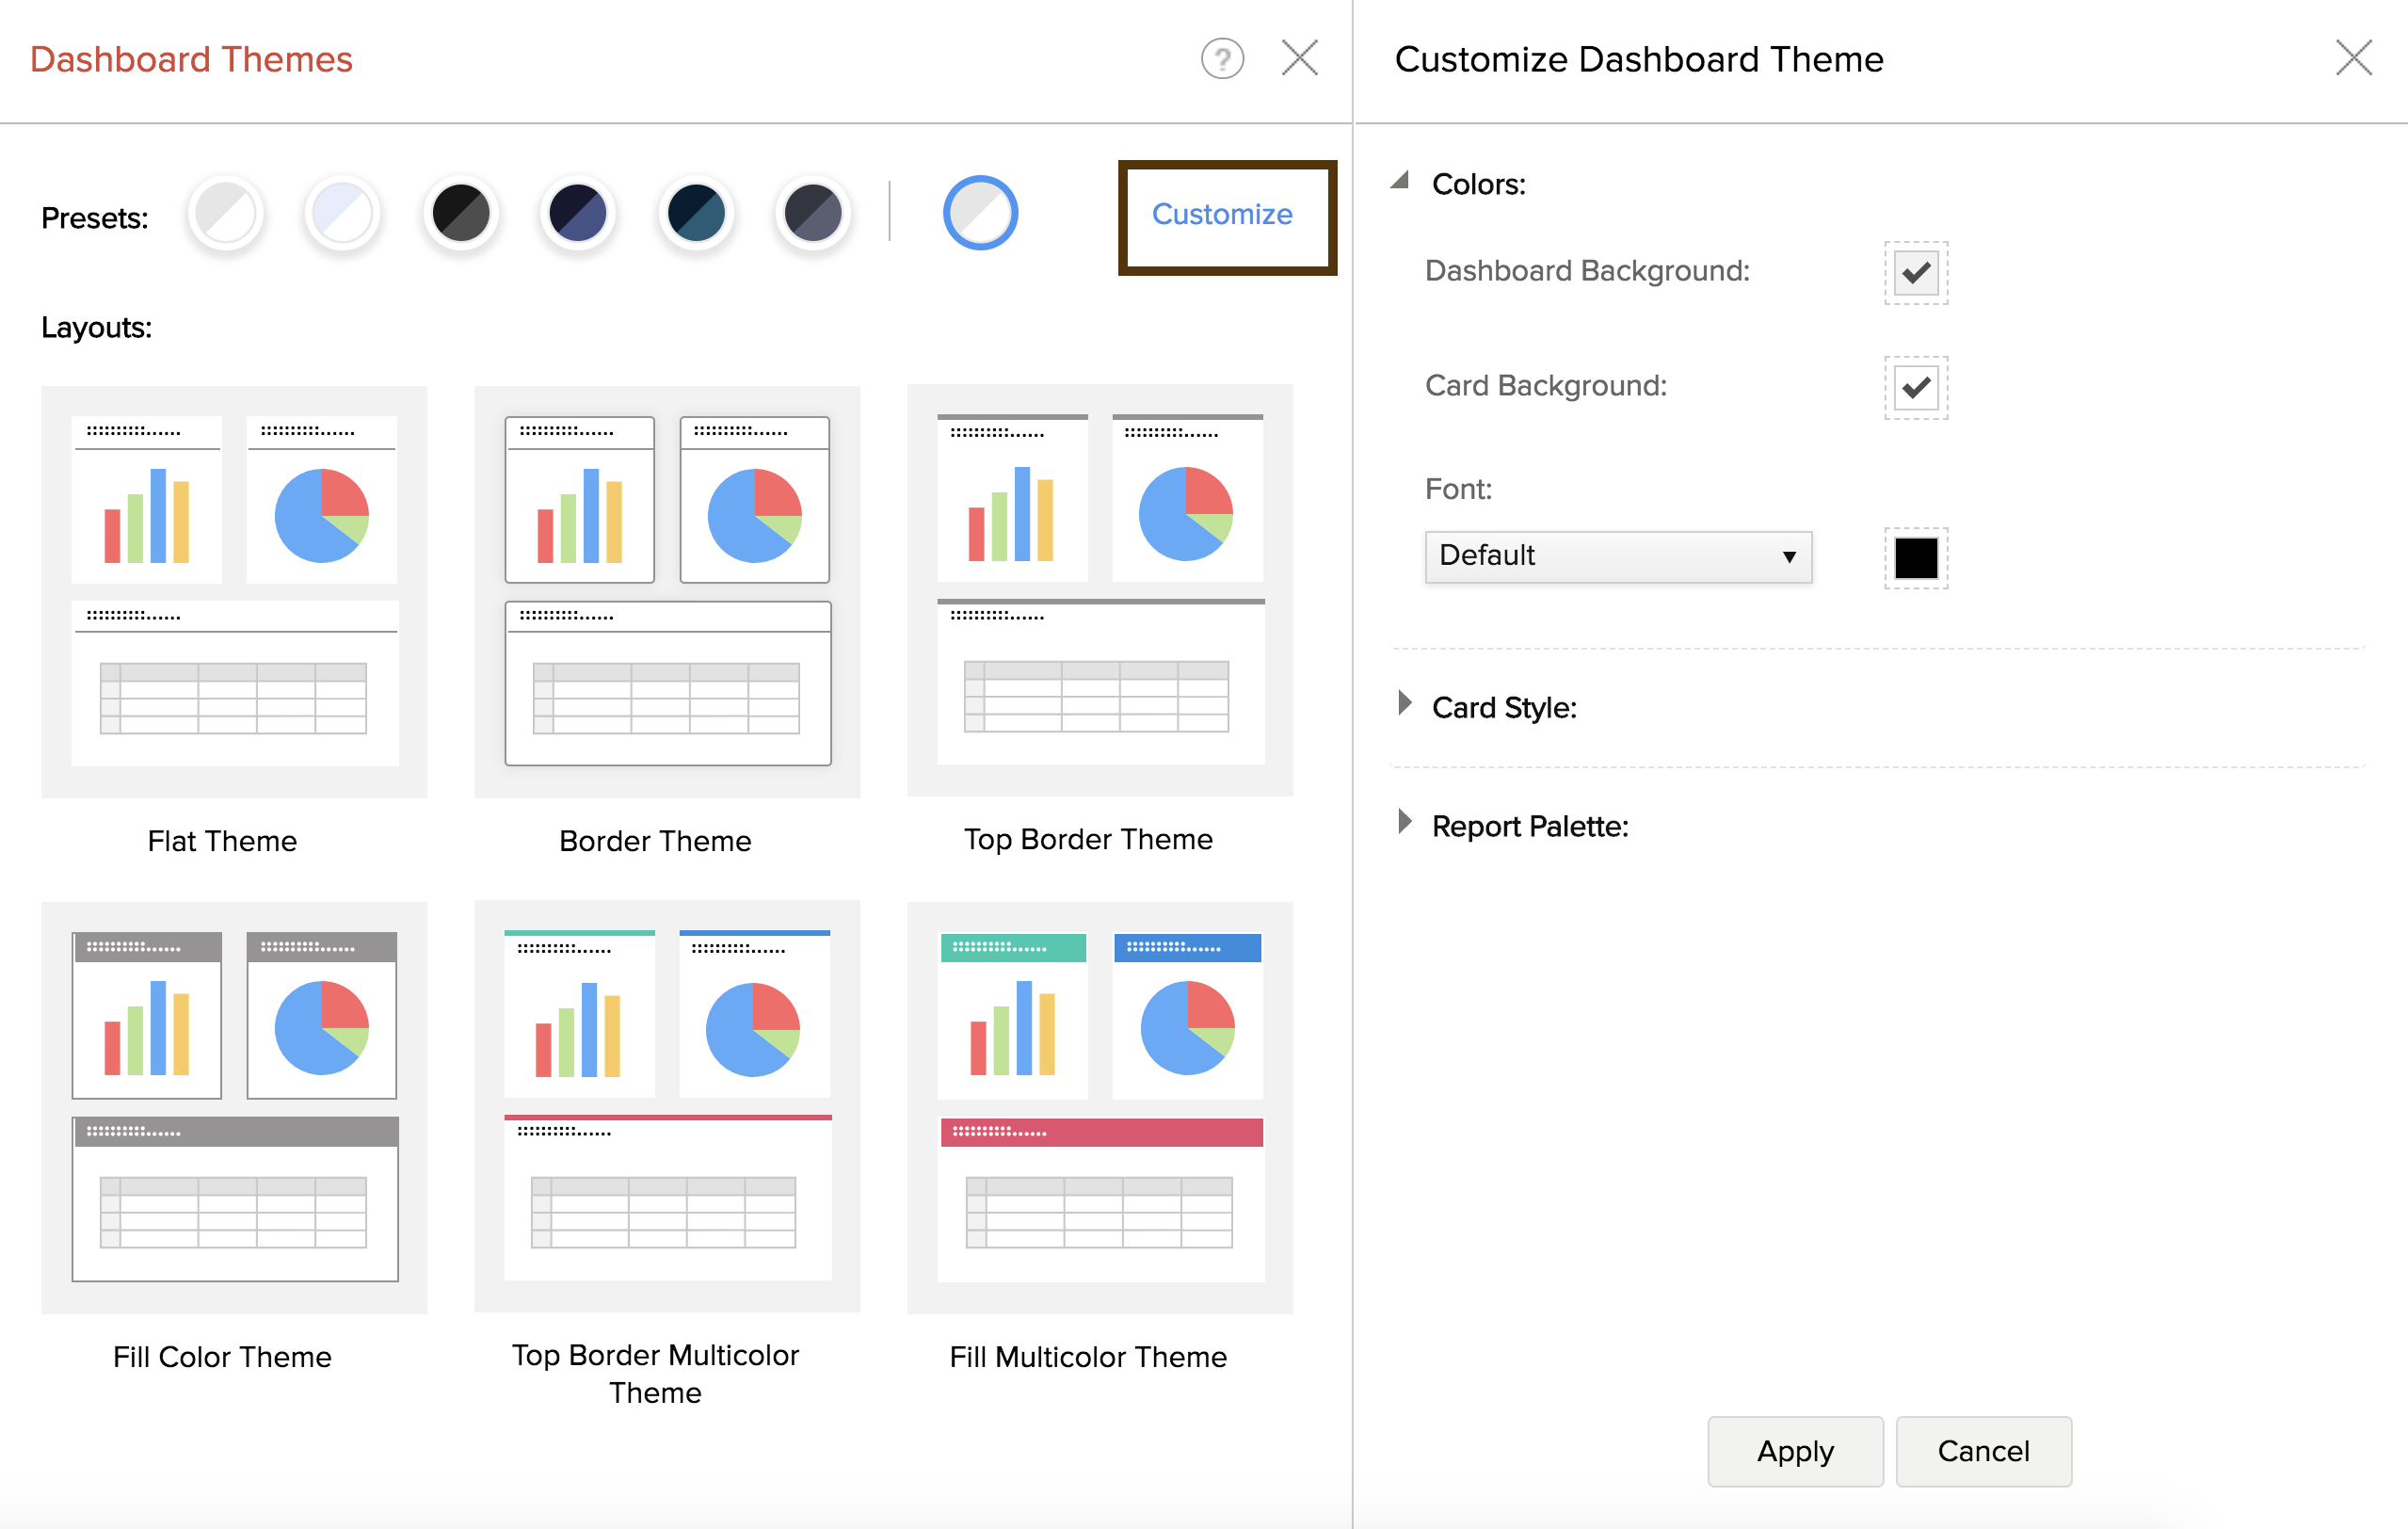
4. New dashboard themes
Now you can customize your dashboards by choosing from any of the six new preset dashboard themes including grey, navy, teal, dark, light, and light blue.
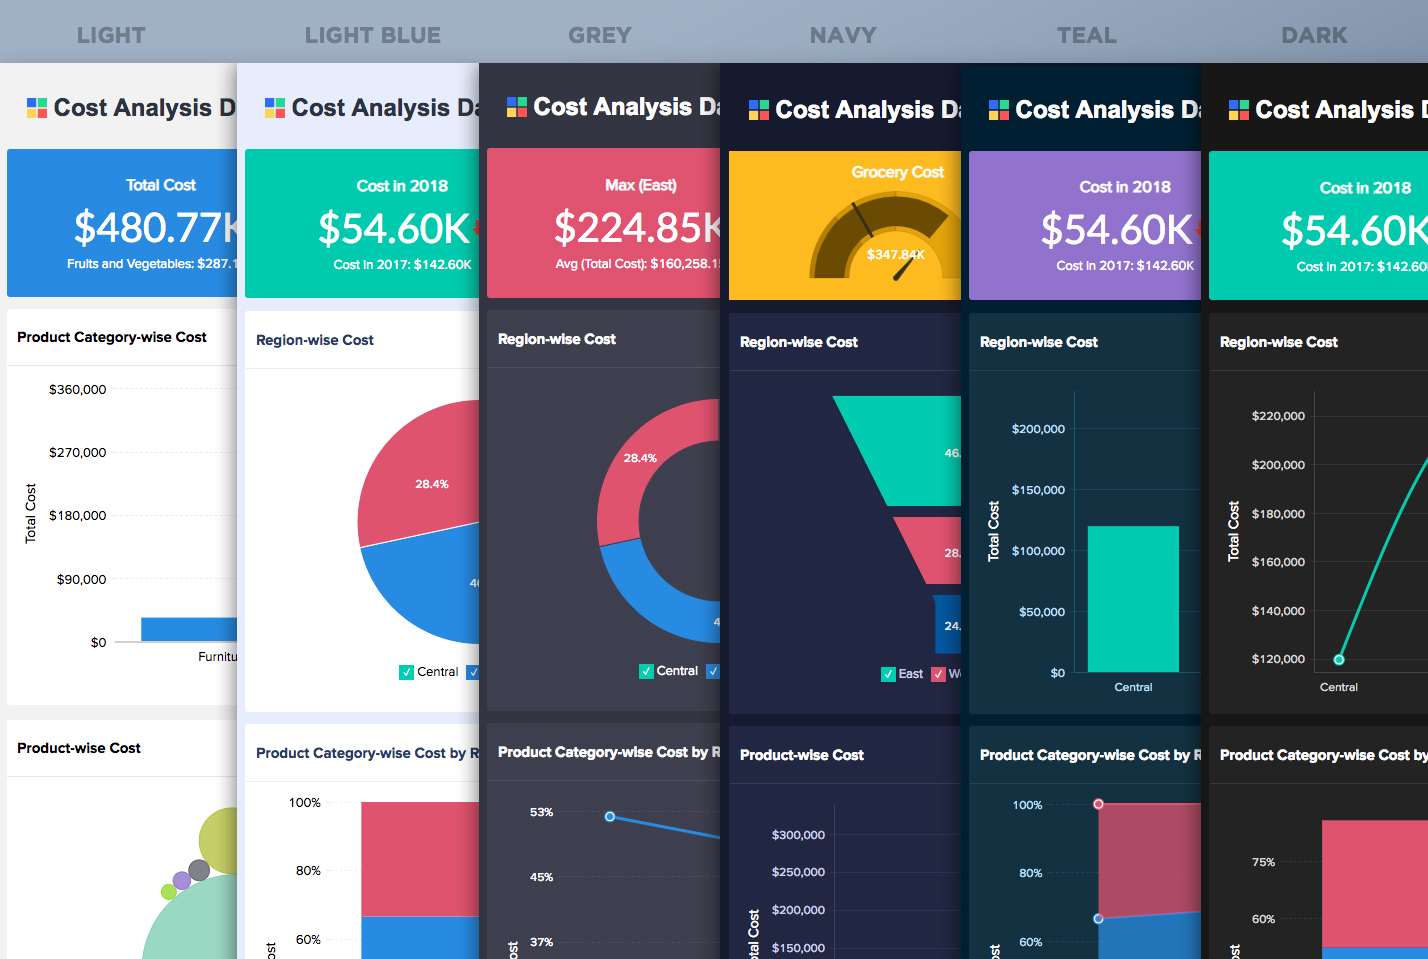
Additionally, you can customize your dashboards further using the Customize option to select dashboard colors, card styles, and report palettes.
5. Advanced summarizing functions for pivots
Introducing advanced summarizing functions in pivot tables such as,
- % of Row in Group - Displays the percentage of the total value of each row within a group.
- % of Column in Group - Displays the percentage of the total value of each column within a group.
- Lookup Value - Fetches value from any of Previous/Next/First/Last cell, based on the Base Field selected.
Click here to know more.
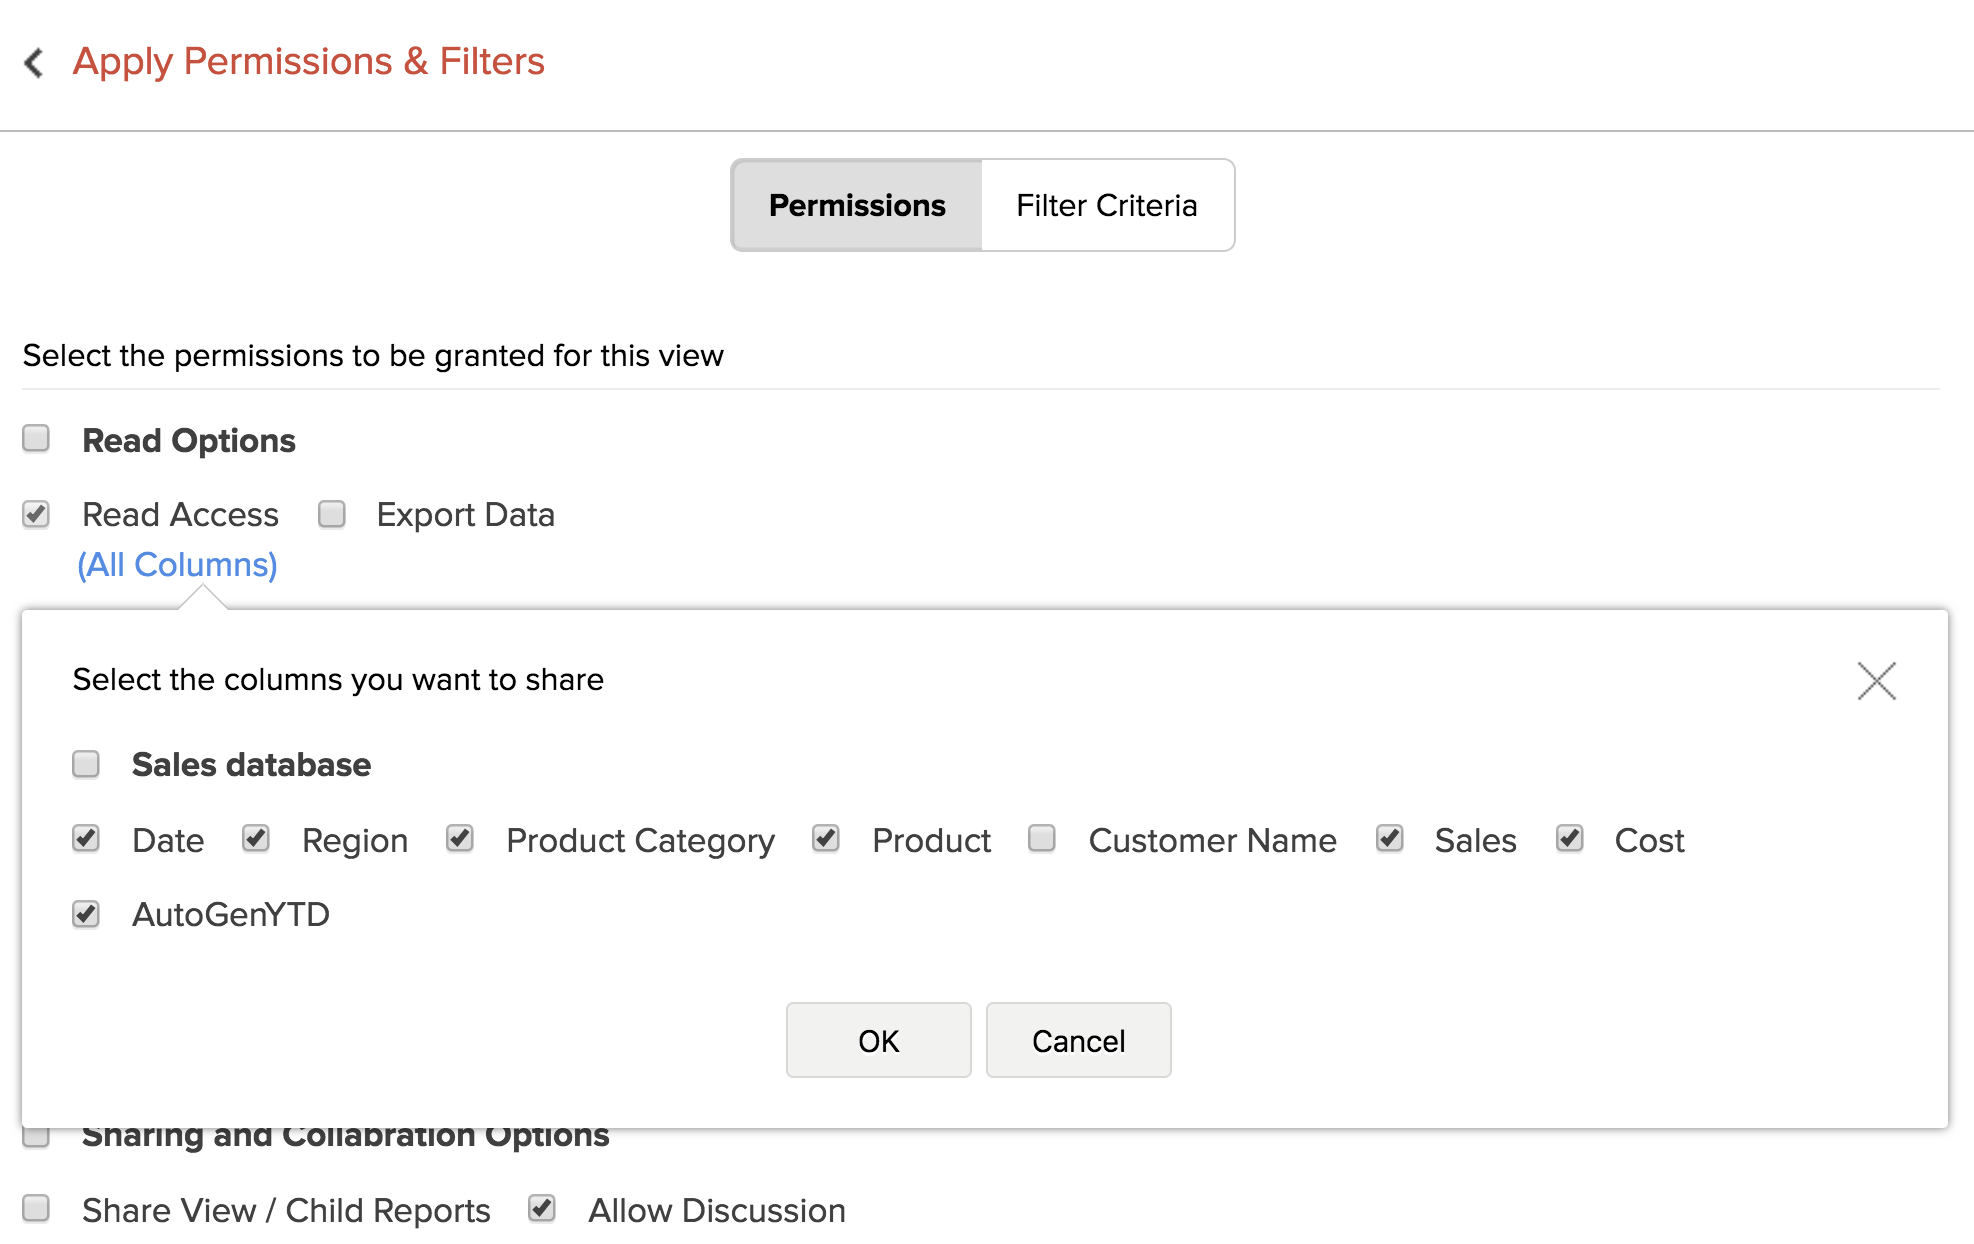
6. Selectively share columns from table
s
While you've always had the option to share data securely with your peers using Analytics Plus, this update takes it a step further. Now you can securely share tables with your peers by excluding columns containing sensitive data or personal information.
7. Configure lookup relationship
While creating reports, Analytics Plus automatically picks the most appropriate lookup column between two or more tables. The new update lets you modify this default lookup relationship and customize your reports any way you like.
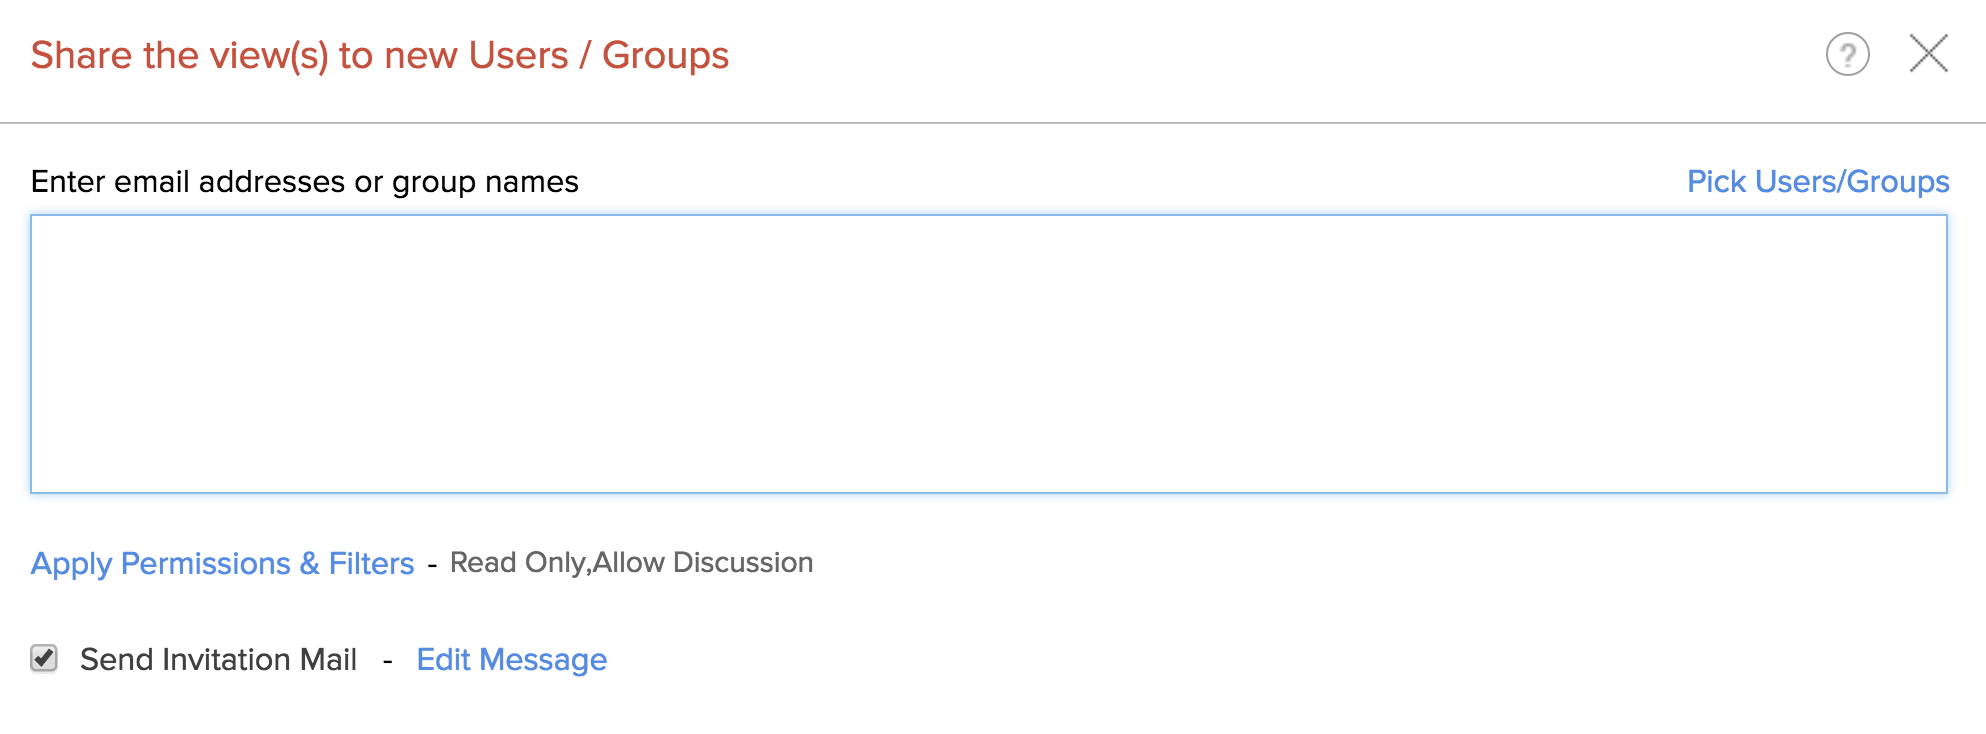
8. Revamped UI for sharing views and creating formulas
Sharing views: The Share the view to new users/groups window has been enhanced to facilitate easy sharing of reports.
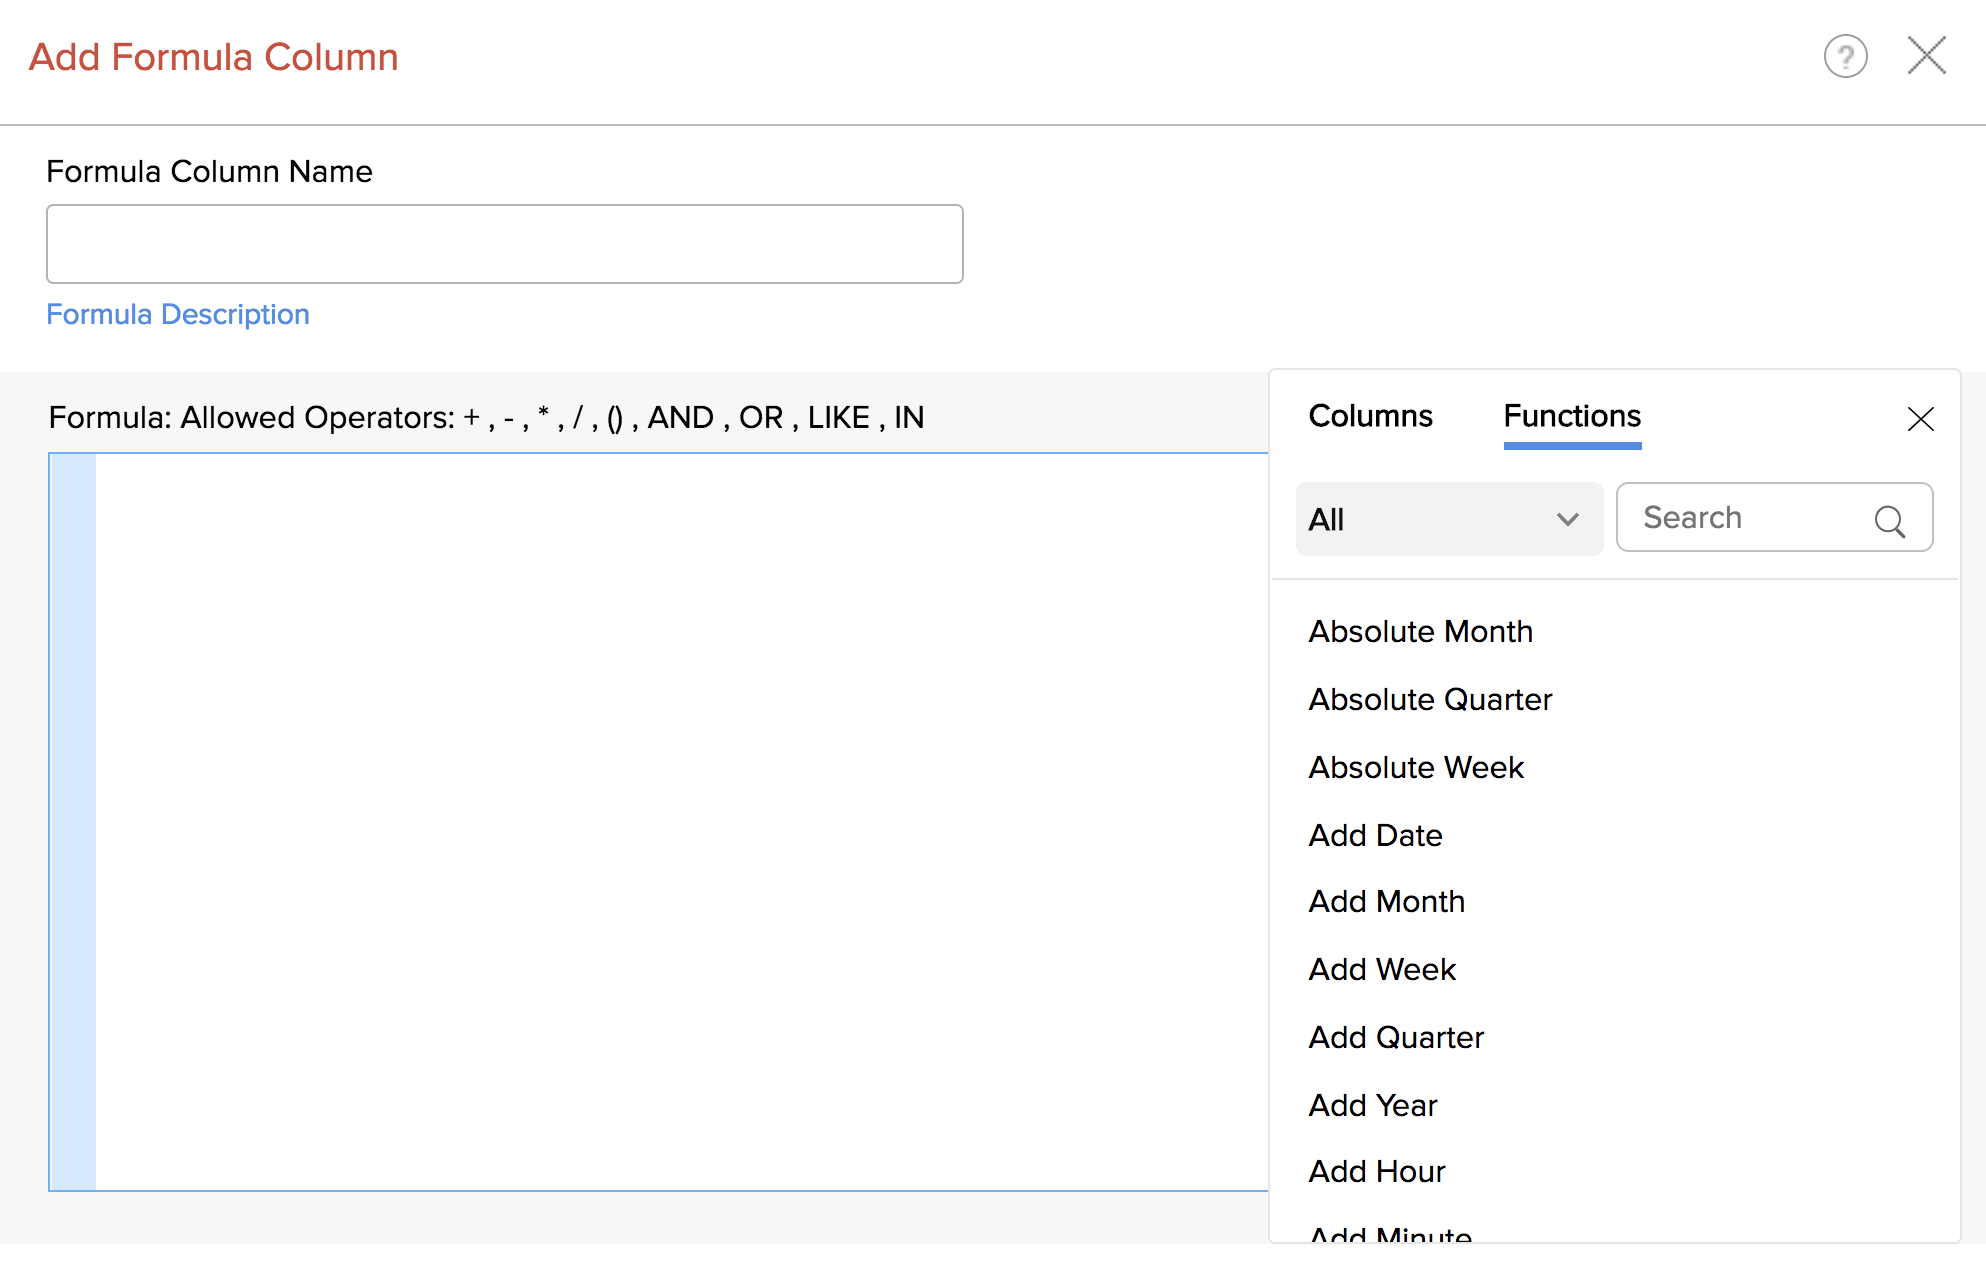
Creating formula: The new Formula dialog box sports a wider formula editor to allow users to access functions and columns easily.
9. Customizable dashboard interactions
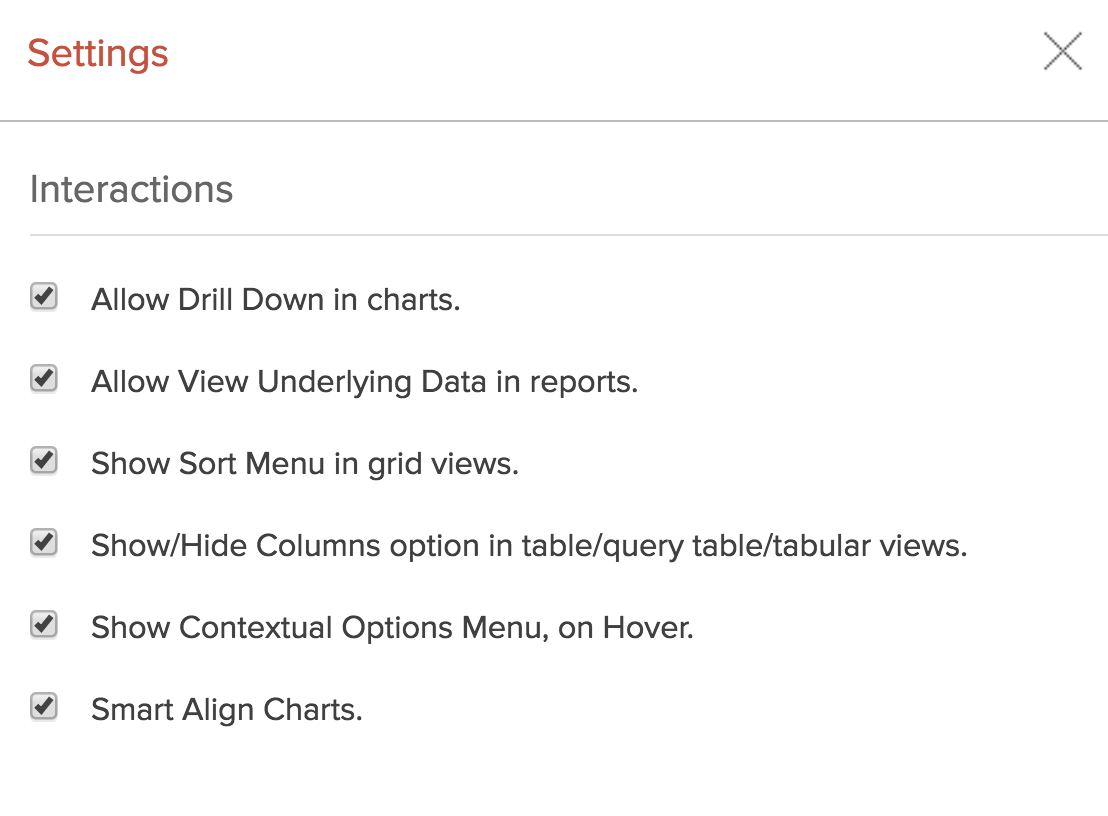
Now you can customize how you want users to interact with your dashboards. The new update lets you enable or disable the following dashboard interactions:
- Drill down option
- View underlying data
- Sort menu
- Smart align
- Show contextual options menu on hover
10. Colored KPI widgets
Add life to your dashboard with vibrant and elegant KPI widgets. With the new update, you can pick colors for each widget in your dashboard.

11. Data alerts
With the latest version of Analytics Plus, you can set up alerts and get notified via email or in-app notifications when your data points breach a threshold. Eg: Email notifications when SLA compliance goes below 90%.
Click here
to find out how to set up data alerts.
Note:
1. Existing users need to be on Analytics Plus build 3700 or above to upgrade to Analytics Plus build 4000.
2. If you've rebranded Analytics Plus,
please follow the steps in this page
to repeat the rebranding procedure.