Device timeline
We're excited to introduce Device Timeline, a major upgrade to Endpoint Central’s DEX module that gives IT teams a clearer, more intuitive way to investigate performance issues.This is currently available for cloud users only.
This feature continuously tracks key device parameters and presents them on a time-sequenced timeline, making it easy to spot anomalies, correlate events, and understand exactly what happened at the moment a user faced an issue.
Why Device Timeline matters
When users report issues, like "My laptop froze around 11 AM,” “Teams lagged during my meeting,” “The system was slow after lunch”, IT often has little context about what was happening on that device at that exact time.
Device Timeline solves that by offering:
Historical telemetry
Minute-level visibility
Context around every user complaint
IT no longer needs to depend on point-in-time diagnostics or guesswork.
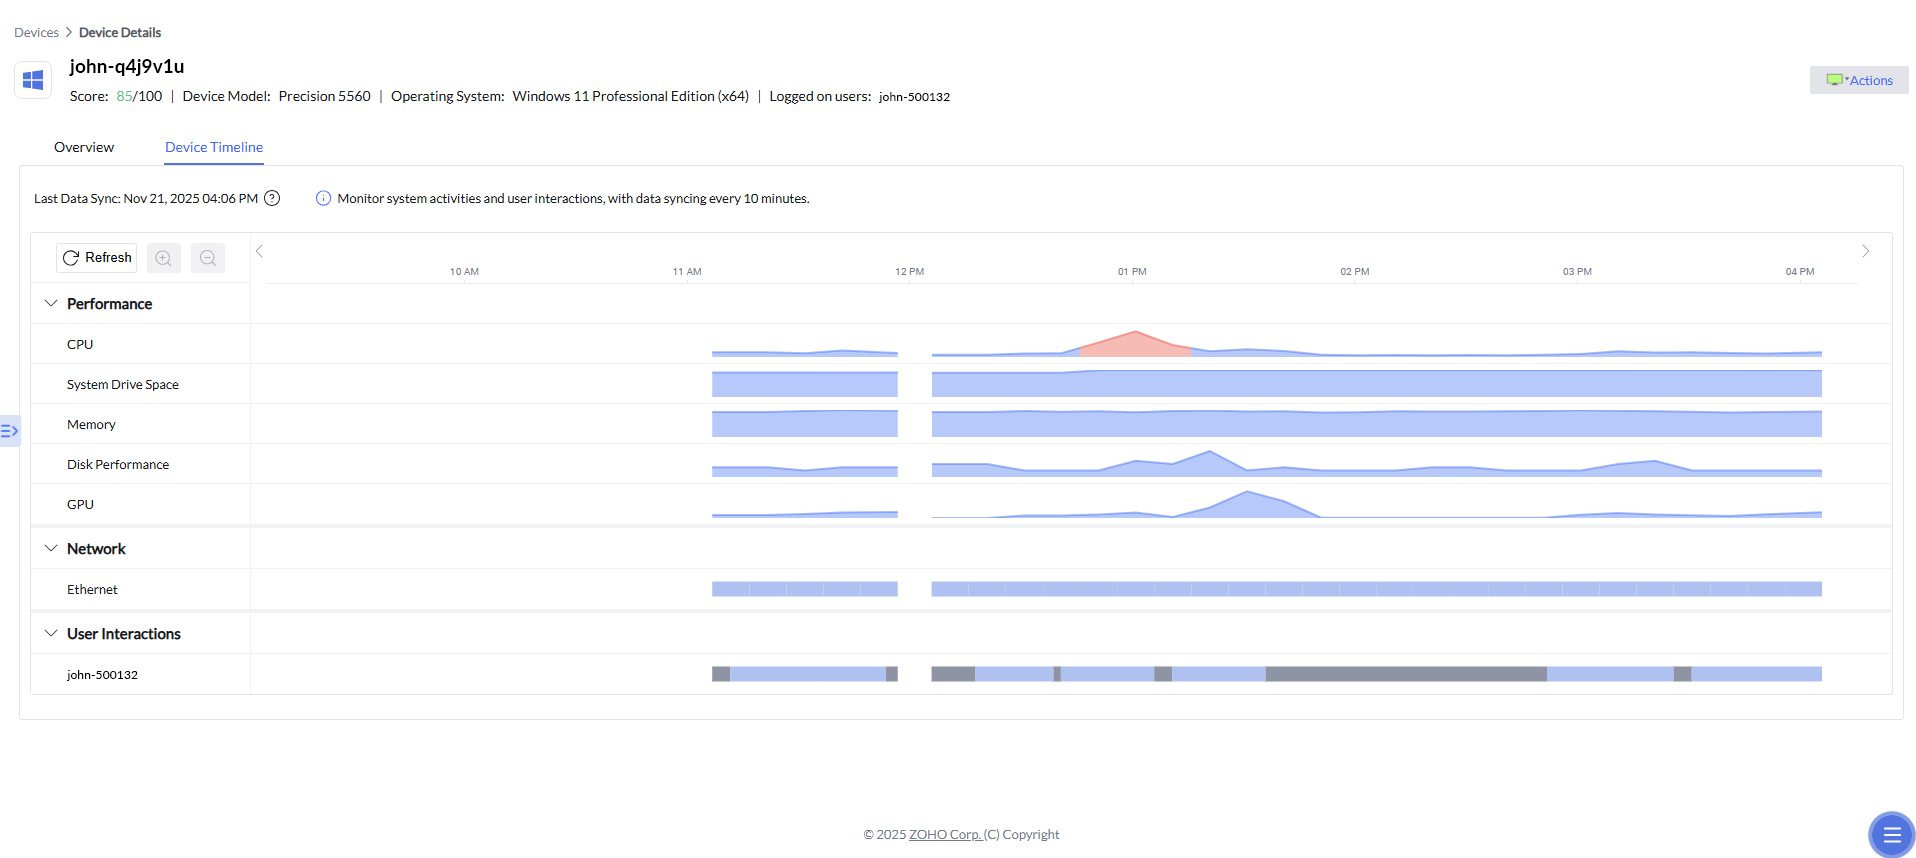
What you can see on the timeline
The timeline displays key performance, network, and user interactions metrics, synced at regular intervals, including:
CPU
System drive space
Memory
Disk performance
GPU
Ethernet
Wifi connectivity
User activity patterns
Each metric is plotted visually so admins can instantly notice unusual spikes or patterns. Devices are continuously monitored and data is posted to the server every 10 mins. We will incrementally be adding more parameters and insights to the timeline and will be making it available for Endpoint Central on-premises as well.
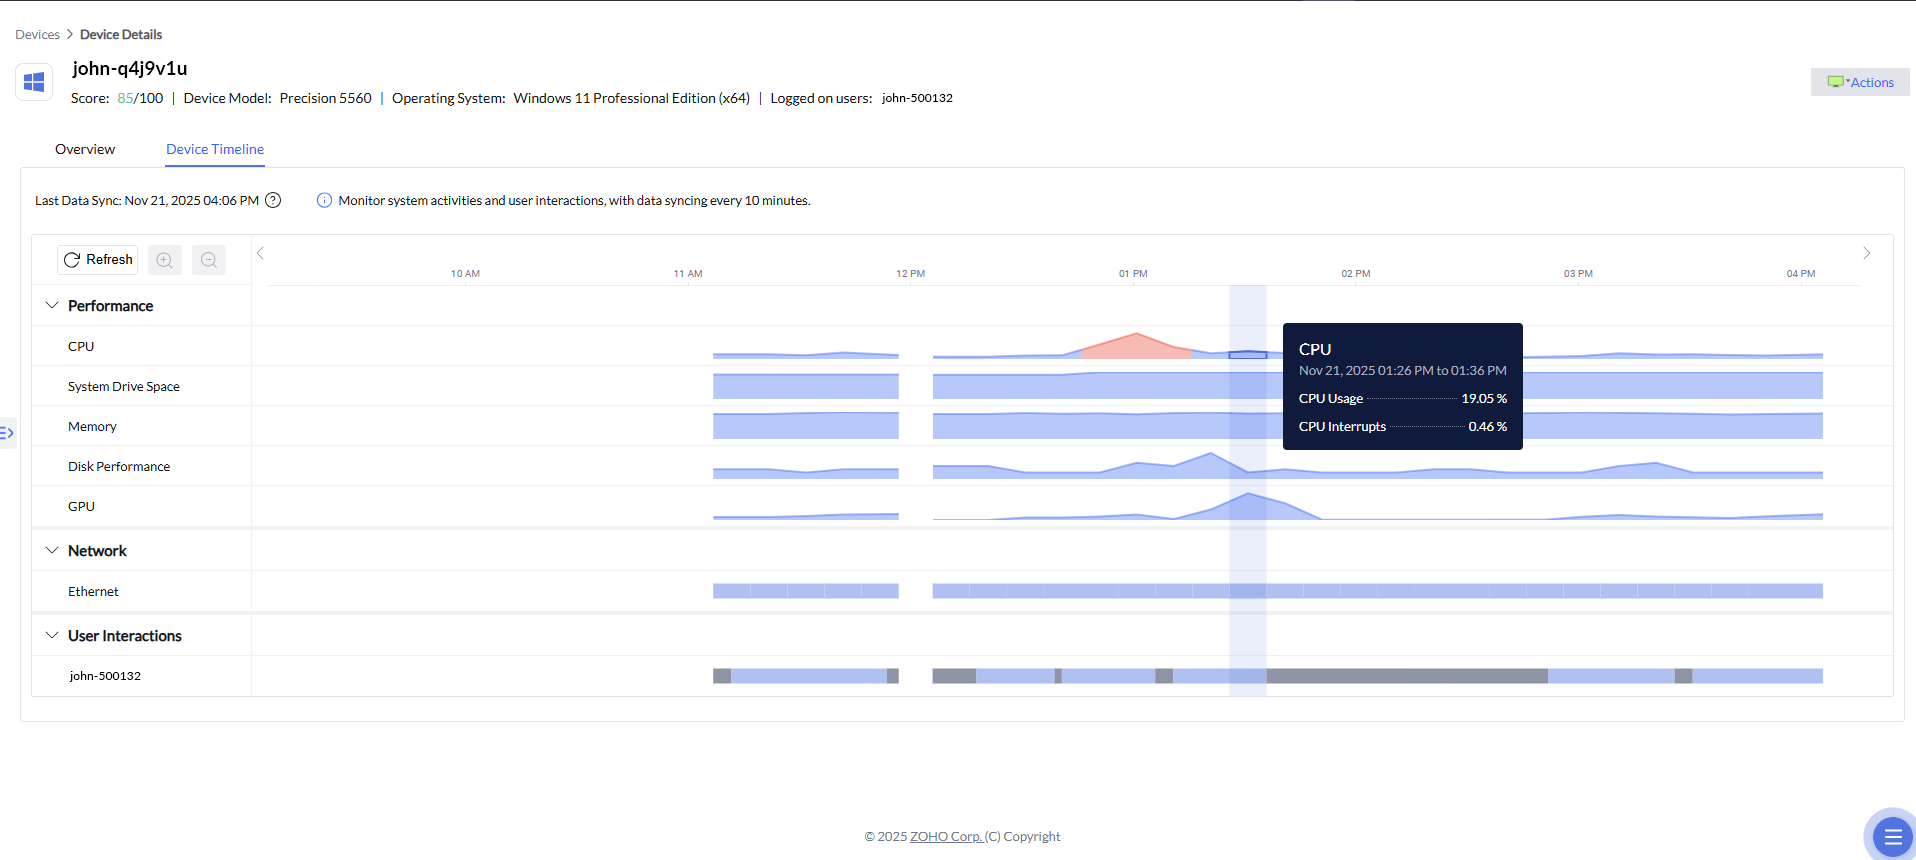
Drill down into any spike or event
The timeline also comes with the ability to drill down into any point on the graph.
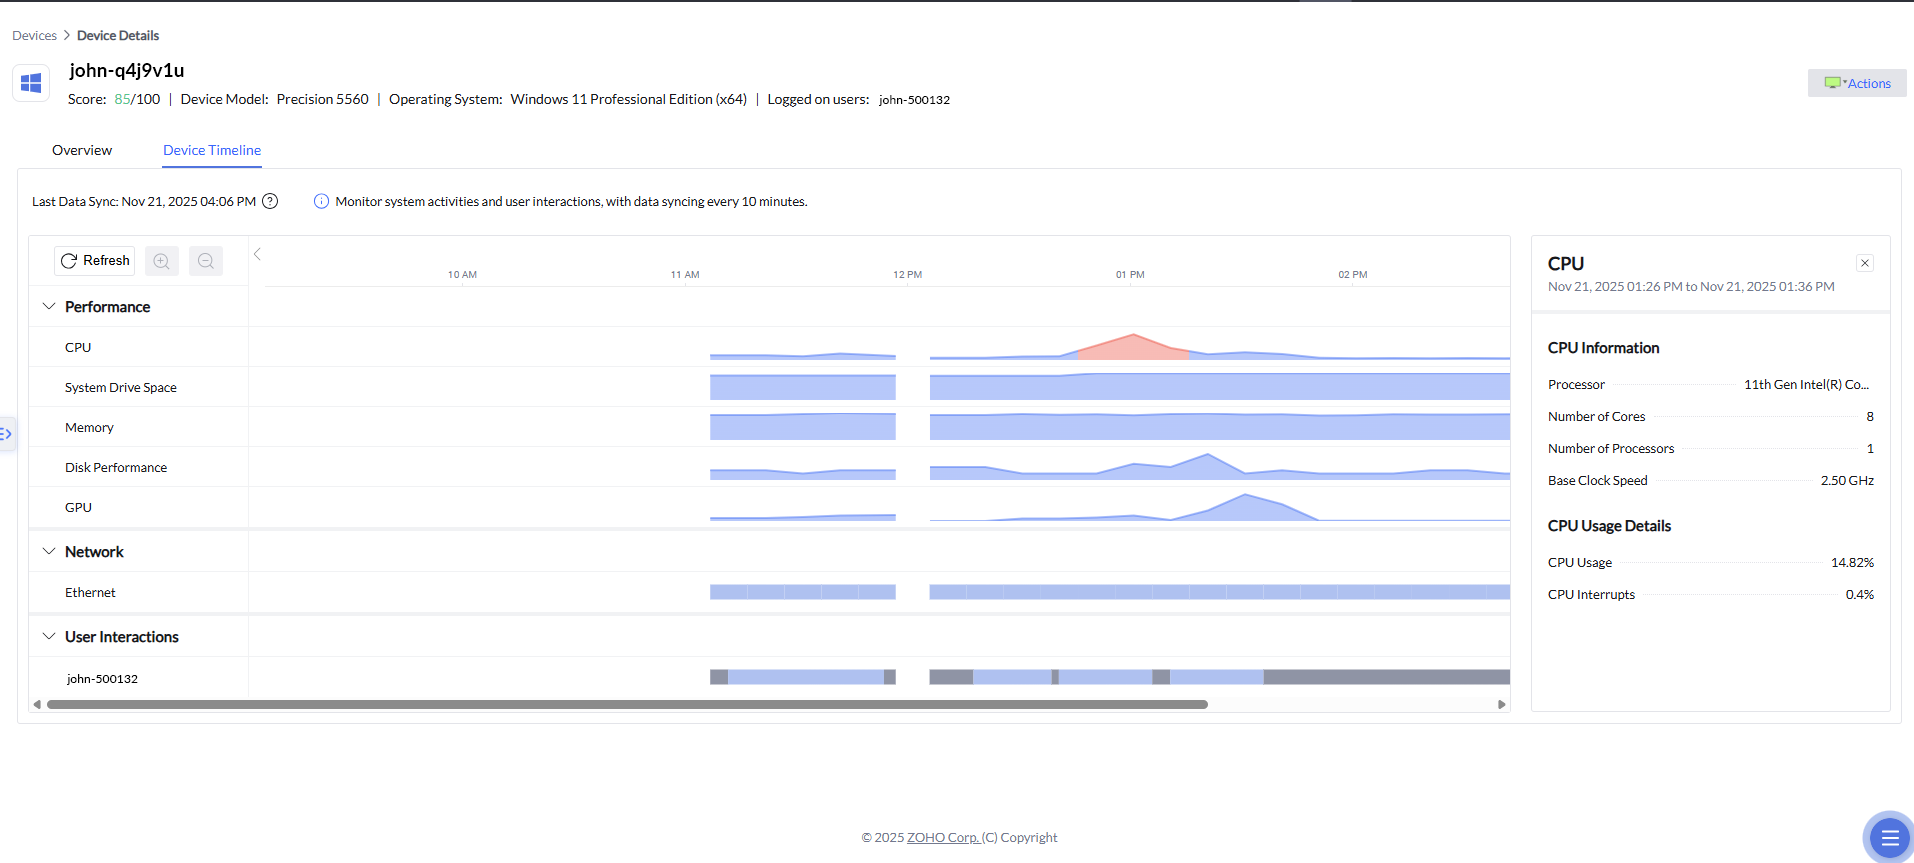
Apart from the information in the popover that comes when admins hover over a section of the timeline, clicking a spike opens a detailed panel on the right showing related telemetry as well, like:
Hardware or subsystem specifications.
Usage details for the selected time period.
Any relevant anomaly alerts associated with that time slice.
Zia Anomaly Detection
Zia Anomaly Detection helps identify unusual system behavior by continuously analyzing CPU, GPU, and memory activity for each device. These metrics are fed into a machine learning model that learns the normal performance baseline over time.
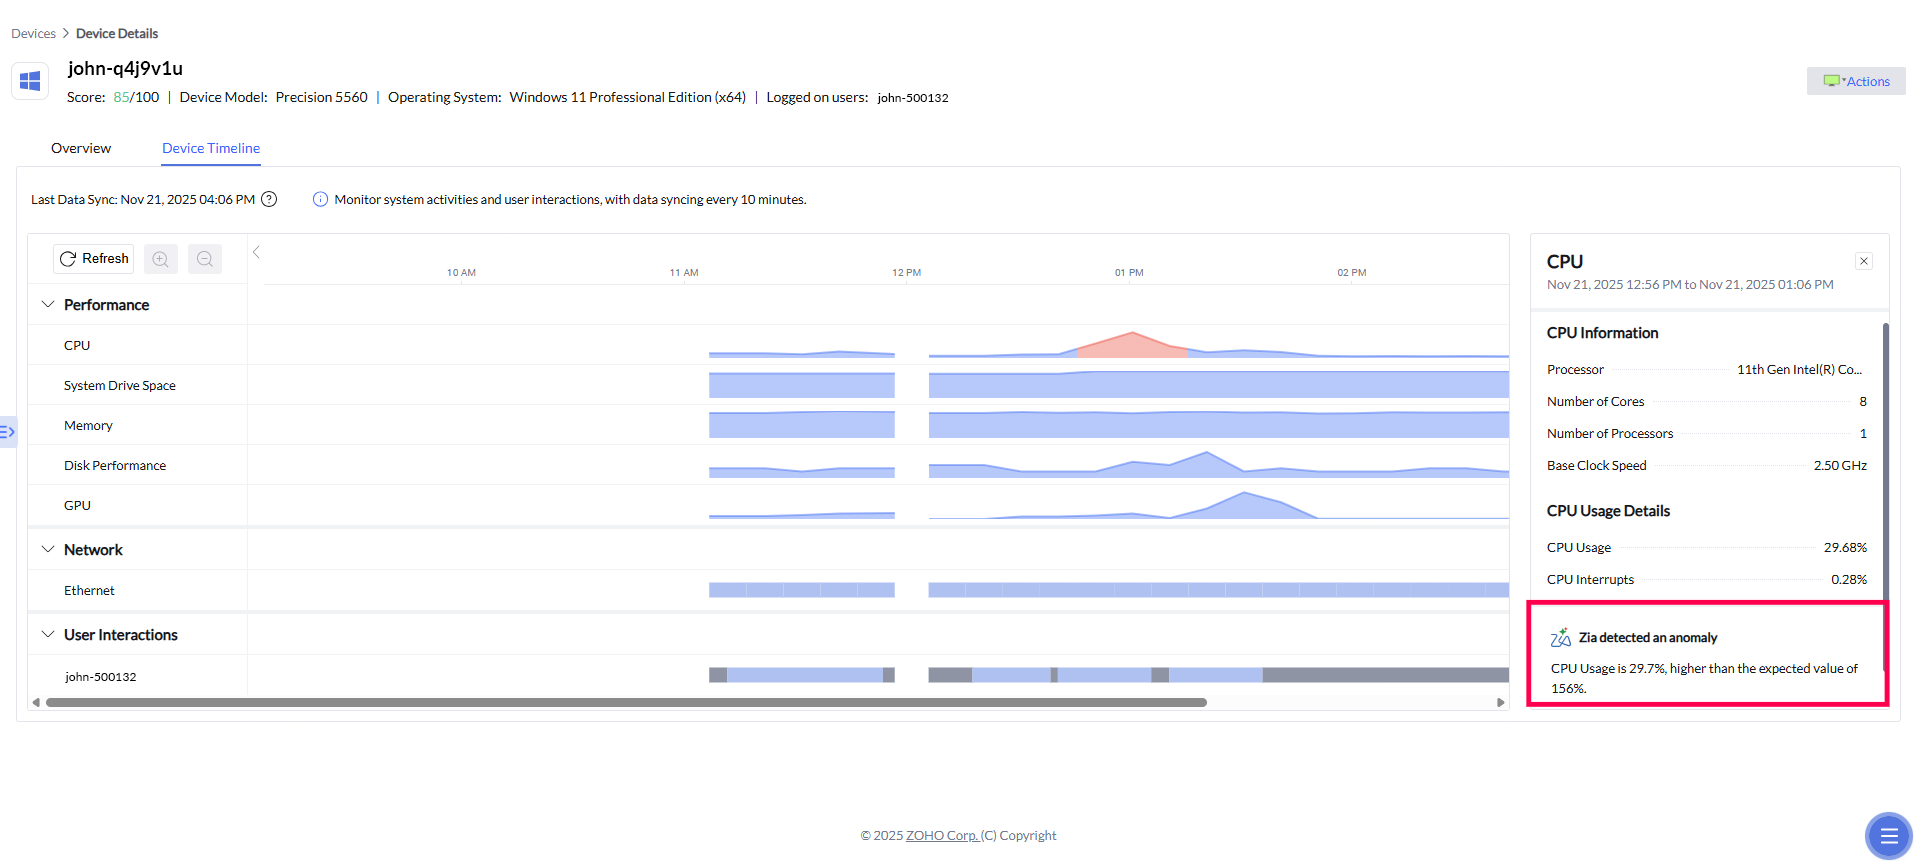
In the example, Zia highlights:
CPU usage significantly higher than the expected range.
The normal operating range for comparison.
An automatically generated insight explaining the deviation.
These insights are extremely helpful when diagnosing performance abnormalities or understanding sudden changes in device behavior.
How are we rolling out the timeline feature?
Cheers,
The ManageEngine team
