We've been setting up ManageEngine ServiceDesk Plus and ManageEngine OpManager with a client recently. A major part of the installation was to setup the self-service user portal in ServiceDesk Plus for greater user access. Given the network service monitoring we were also configuring in OpManager this prompted the question as to whether it was possible to offer some form of live system monitoring in the ServiceDesk Plus self-service portal.
Here's what we came up with ....
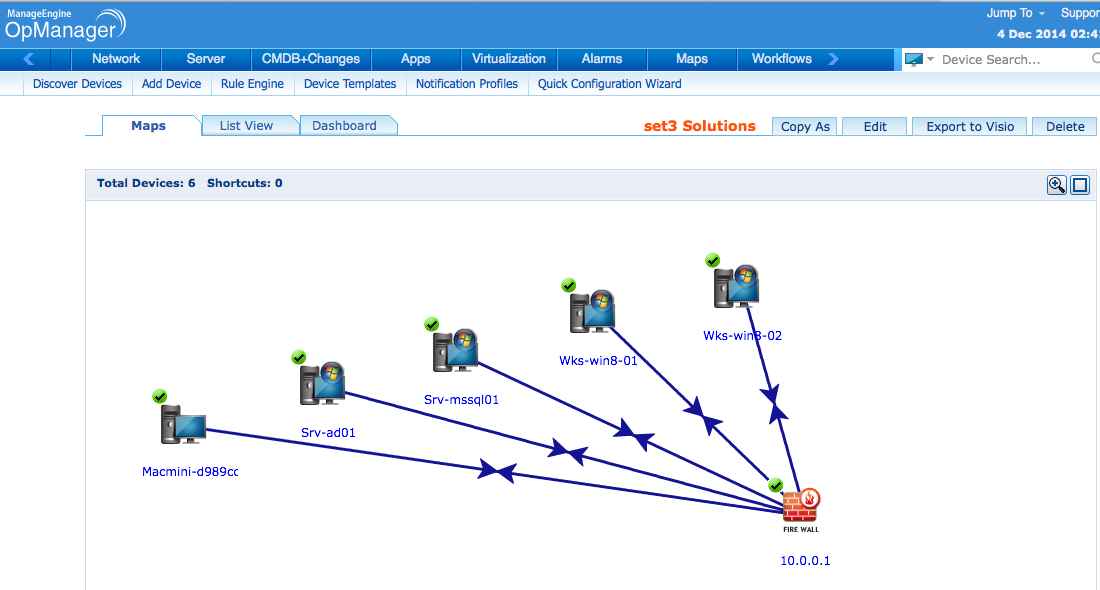
First off OpManager. The basic requirement is for a simple display of network and system status. This was easily achieved in a business view following a network discovery and tuning off the system monitoring thresholds. Once done it's easy to create a simple business view that includes network monitoring objects or shortcuts to a group of devices being monitored:
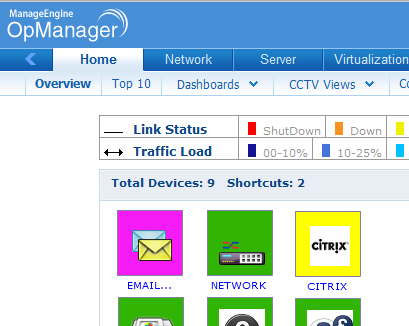
There are a range of tricks you can use in the OpManager Business View editor to display the monitoring objects. For example decide if you want a text label, whether to truncate the text (great for inserting a simple label in front of a complex hostname), it's font and orientation and even if you want to use a custom icon rather than a simple dot:
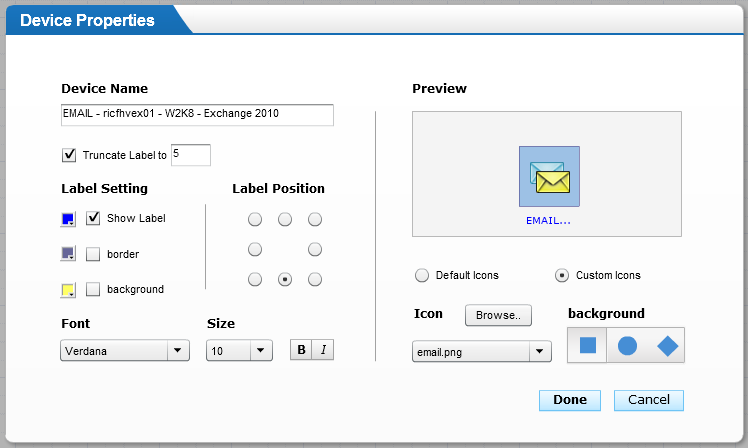
You'll find these on the server where ManageEngine ServiceDesk Plus is installed in the folder '\custom\serviceicons'.
Next create a single column Dashboard layout in OpManager with the widget 'General > Business View'. Once the widget is added you'll need to set the widget to pick up your live status Business View you've just created:
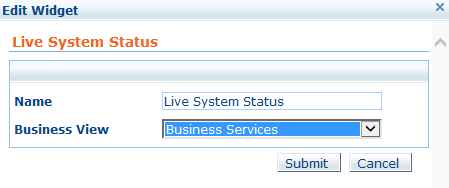
Next create a single column Dashboard layout in OpManager with the widget 'General > Business View'. Once the widget is added you'll need to set the widget to pick up your live status Business View you've just created:
All good so far?
Next up you'll need to grab the HTML to embed the widget in an HTML page. You can grab this from the Embed menu option off the Business View widget and copy the code snippet:


The code snippet should be an HTML iframe statement.
To fit it into the self-service portal of ManageEngine ServiceDesk Plus we'd recommend changing the width of the iframe to be no more than 250 pixels.
Almost there ....
Now take your code snippet and place it in the 'SelfServiceHelp.html' file, located in '\custom', as appropriate. Now when you login into ServiceDesk Plus as a user you should be presented with live system status monitoring in the right -hand pane of the Home tab of the user portal:
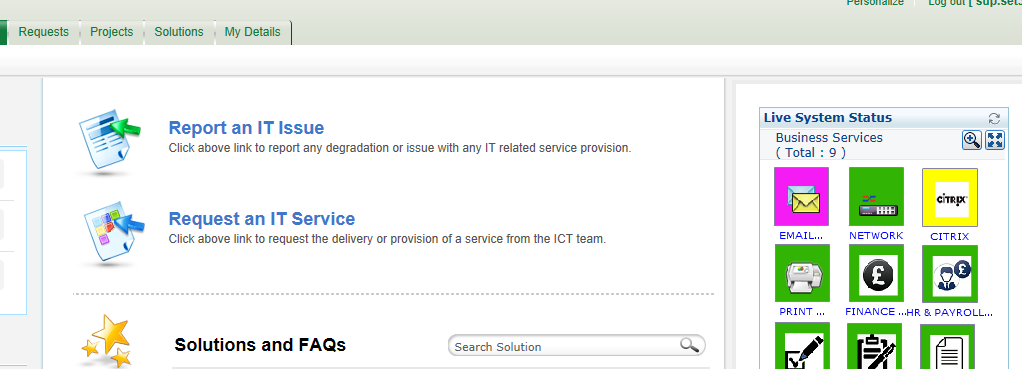
Now take your code snippet and place it in the 'SelfServiceHelp.html' file, located in '\custom', as appropriate. Now when you login into ServiceDesk Plus as a user you should be presented with live system status monitoring in the right -hand pane of the Home tab of the user portal:
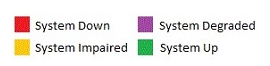
What we also found useful was to create a key to explain the various monitoring states of OpManager to the users as a small graphics file:
Given ManageEngine ServiceDesk Plus already has a built-in web server it was easy to get ServiceDesk Plus to display this graphic from the 'ServiceDeskHelp.html' file. To do this simply locate your graphic file in the folder,
'\applications\extracted\AdventNetServiceDesk.eear\
AdventNetServiceDeskWC.ear\AdventNetServiceDesk.war'
and call it using the HTML image argument.
Enjoy!
For more useful tips visit
http://set3manageengineuk.blogspot.co.uk
