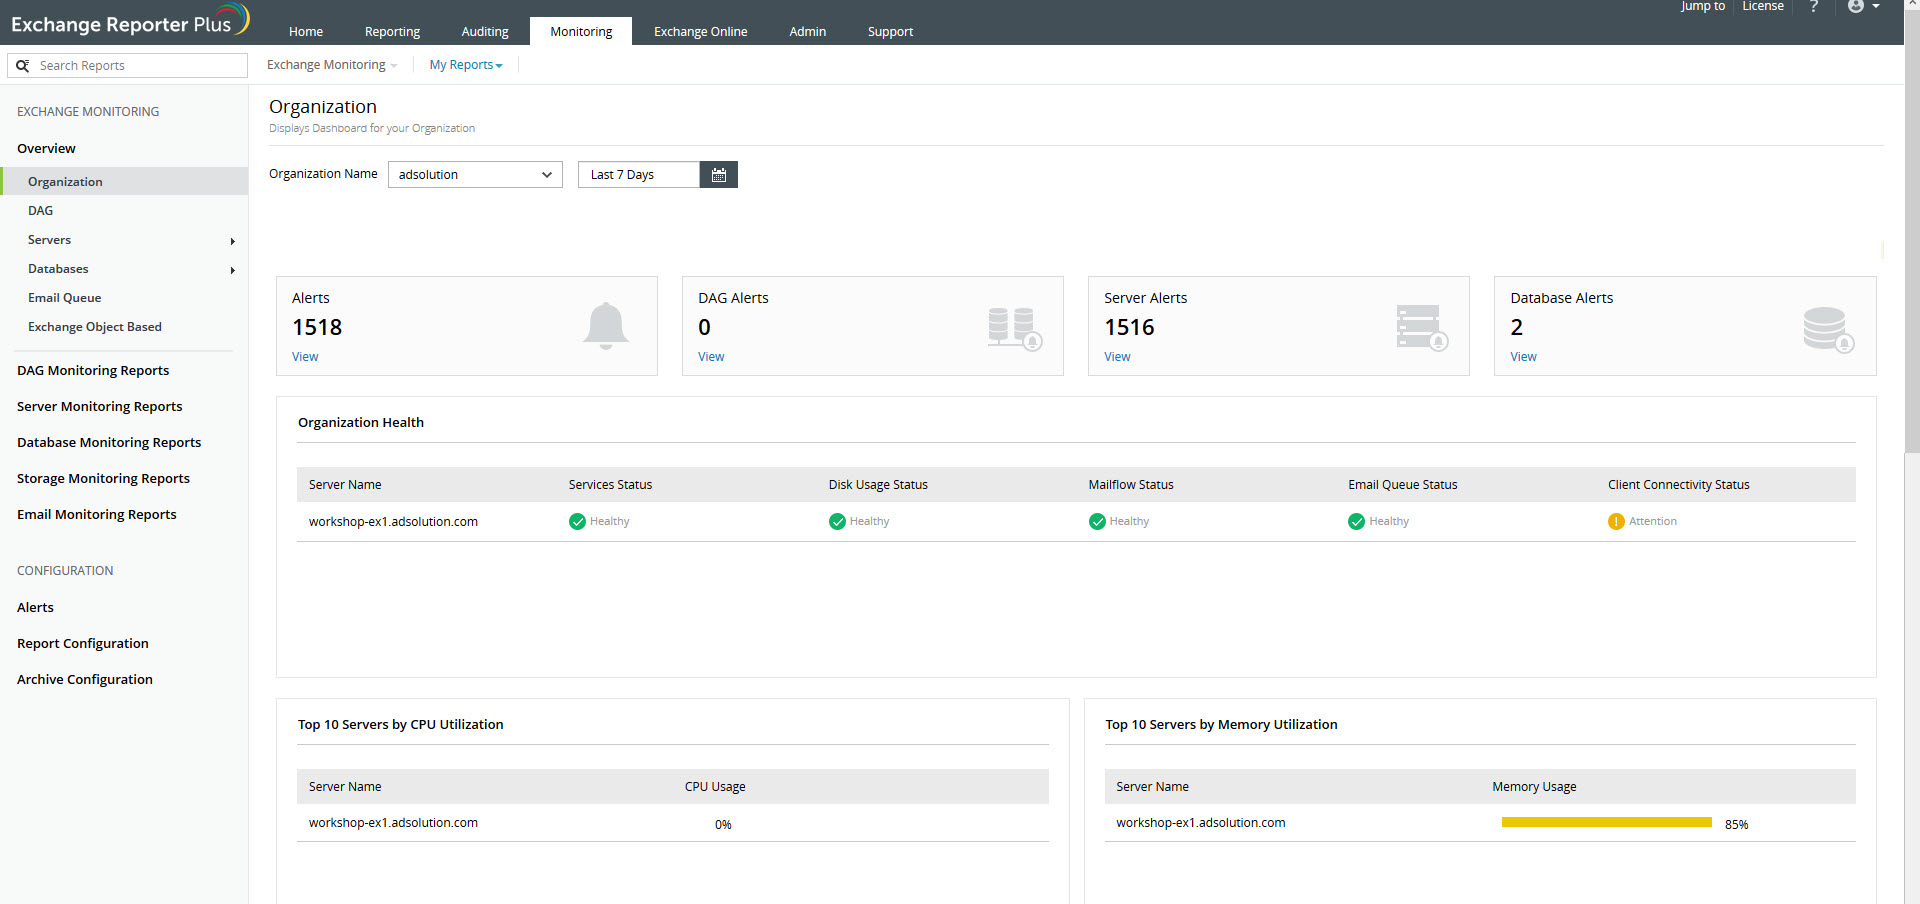
How do I get insights into Exchange Server health?
Accessing the dashboard:
Go to the Monitoring tab.
Click any of the links under Overview.
Dashboard components:
Exchange Reporter Plus helps you monitor the health of various aspects of your Exchange environment, including:
CPU and memory utilization: Get complete details about CPU and memory usage in your organization.
DAGs: View information about replication health, database copy status, DAG network health, and activation preference details.
Servers: Monitor Exchange Server health and connectivity for different server roles.
Databases: Monitor database backup, Exchange search health, and MAPI connectivity.
Email queues: Get details about message queues including submission, poison, and unreachable queues.
Each of these graphical widgets also show the recent alerts generated, in addition to clear-cut bar graphs, pie charts, and tables on Exchange health.

Topic Participants
Siva Prakash