How can analytics help you with continuous service improvement?
Continual service improvement (CSI) is at the crux of IT service management. CSI aims to continually improve the efficiency and the effectiveness of services, and processes. Broken down in simple English, CSI is comparing your current efficiency levels with your past performance and making sure you see an improvement.


How can
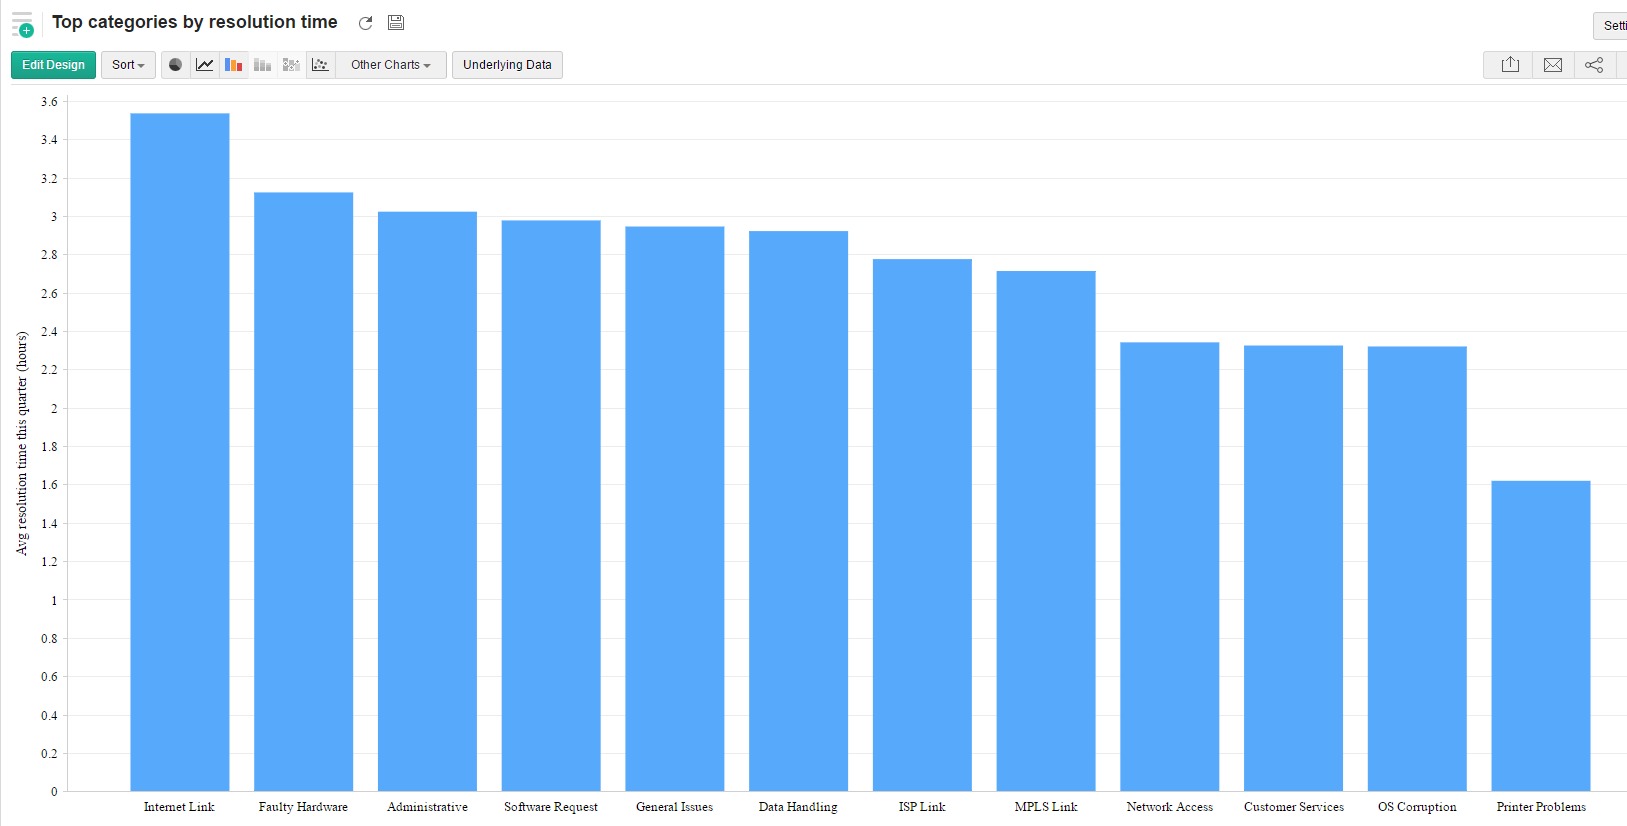
Analytics Plus help you do that? Let's say you want to find out areas that your technicians lack expertise. No matter how good your technicians are trained, there are going to be areas that they take some extra time to provide answers or appropriate resolutions. Identifying the top categories of requests with the longest average resolution time should give you the answer.
Here is a sample of what that report would look like.

And here is a video on how you can build this report.
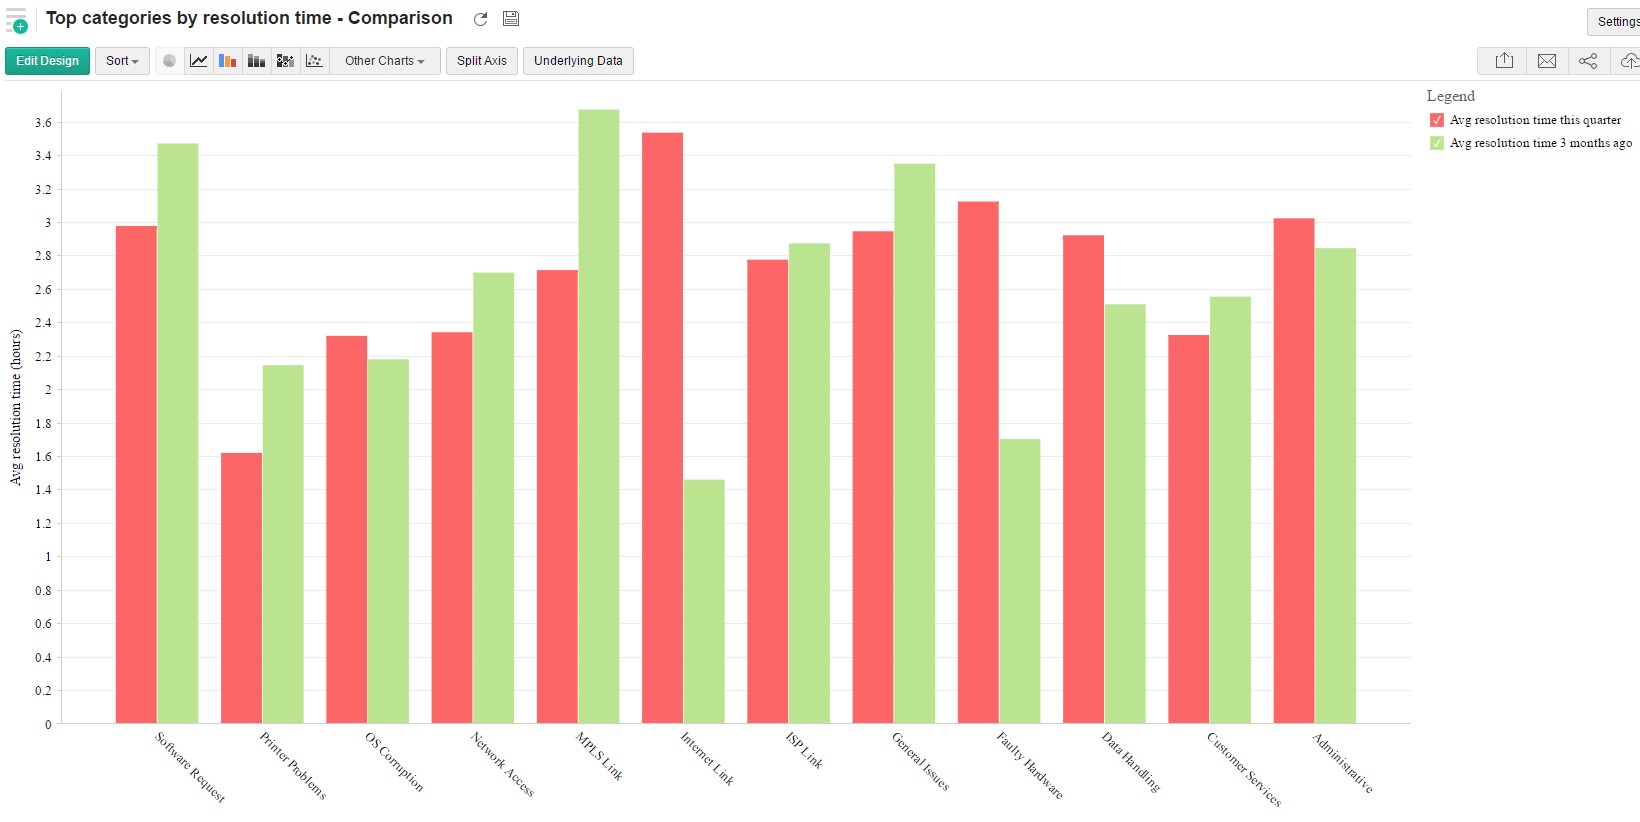
Ok great, now you have a report showing you the top 5 weakest categories. So how do you compare this with your performance in the past? Create a calculated field that will compute your average resolution time 3 months from the present date and introduce it into this report.
Here is a sample of what your report will look like. In this report, you will be able to view the resolution times in the present quarter and compare it with that of the previous quarter and visually analyze if you have made an improvement. Categories where the red bar is shorter than the green bar indicate an improvement in resolution times.

Here is the video outlining this.
Formulas you will need to create the calculated fields used in these reports.
Avg resolution time of requests this quarter -
Avgif(absquarter("Request"."Resolved Time")=absquarter(currentdate()),"Request"."Time Elapsed in Hrs")
Avg resolution time 3 months ago-
Avgif(Dateandtimediff(DAY,"Request"."Resolved Time",currentdate())>90 and Dateandtimediff(DAY,"Request"."Resolved Time",currentdate())<180,"Request"."Time Elapsed in Hrs")
Topic Participants
Rakesh
New to M365 Manager Plus?
New to M365 Manager Plus?
New to RecoveryManager Plus?
New to RecoveryManager Plus?
New to Exchange Reporter Plus?
New to Exchange Reporter Plus?
New to SharePoint Manager Plus?
New to SharePoint Manager Plus?
New to ADManager Plus?