Drill deeper, troubleshoot faster: Applications Manager + Prometheus Integration for Nginx and Kubernetes
Hello Everyone,
We are elated to announce a new enhancement in Applications Manager!
We have added support for Prometheus monitoring mode for Kubernetes and Nginx monitor types. This is in addition to the existing Prometheus monitoring mode support for OpenShift and Tomcat servers. This option will allow you to leverage Prometheus's powerful monitoring capabilities directly within Applications Manager, providing more in-depth insights and improved monitoring efficiency for your Kubernetes and Nginx environments.
Unlike SSH and kubectl for Kubernetes and REST API for Nginx, which rely on periodic polling and command execution, Prometheus adopts a pull-based model. This method significantly reduces overhead and latency in data retrieval. Instead of continuously querying endpoints, Prometheus servers actively scrape metrics from configured targets (at regular intervals), ensuring near-real-time updates without placing undue load on monitored systems.
Prometheus integration enables agent-based monitoring,which enhances security by operating within the managed environment, minimizing exposure to external threats.
Additionally, Prometheus integration enables discovery of Kubernetes and Nginx servers from an existing Prometheus server. This discovery feature simplifies the setup process, instantly categorizing and tracking these instances, ensuring you get critical metric data without manual intervention.
How to get started?
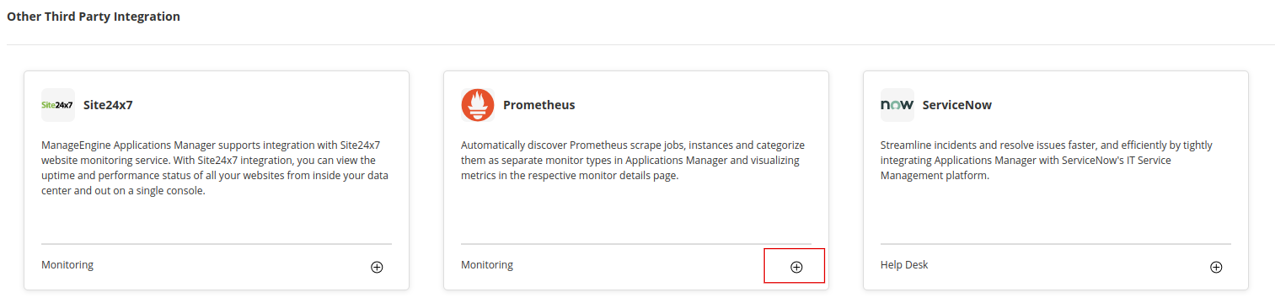
- If you have not enabled Prometheus Integration in Applications Manager, you can navigate to “Settings->Add-on Settings” and click the plus icon
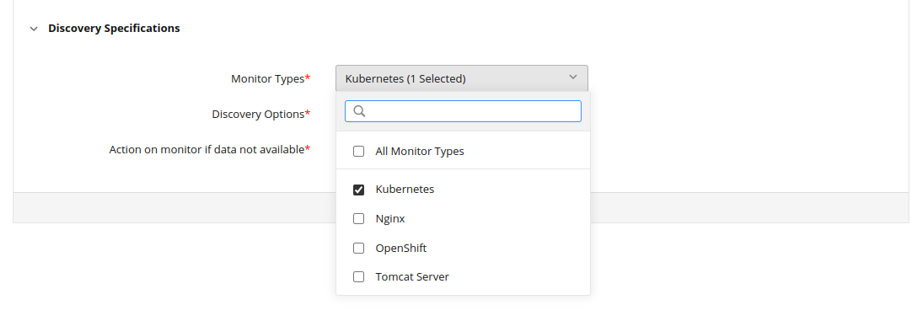
- You will then need to enter details such as mode of data collection, Prometheus server type, authentication, etc. Under ‘Discovery specifications’ section,select the monitor type to be discovered in the drop-down menu as shown in the image below:
- Finally, save your preferences to discover the required monitors from the Prometheus server.
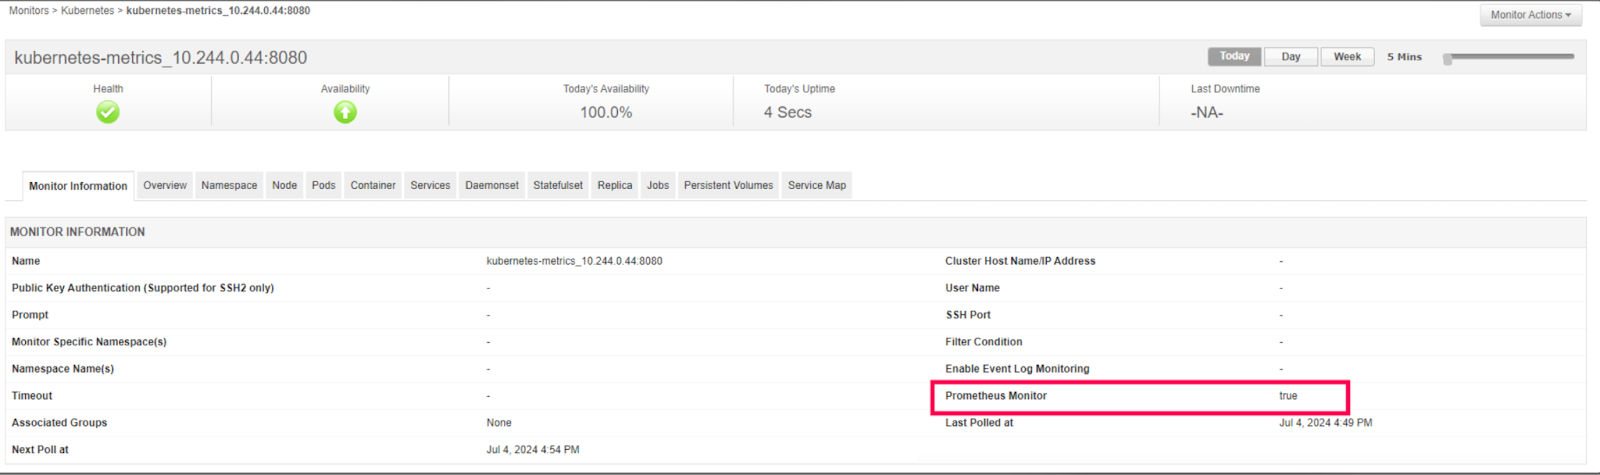
- Once you discover an instance from Prometheus, you can view it under ‘Settings->Add-on settings->Prometheus’ and also in the monitor view. For example, information of a Kubernetes monitor, as shown in the image, now includes a 'Prometheus Monitor' status set to 'true', indicating successful integration and monitoring by Prometheus within Applications Manager:
Learn more about setting up the monitor with Prometheus integration.
