Do you know what's your response-to-resolution time?
As a help desk manager, you already know first hand that request resolution times are just as (or even more) important that first response times. Because even though requesters may appreciate receiving a prompt response from your technician after raising a request, unless it is followed by timely resolution of the request, it can lead to customer dissatisfaction. Which is why it is important for a help desk manager to closely monitor the time difference or the time lapse between first response and request resolution, also dubbed response-to-resolution time.
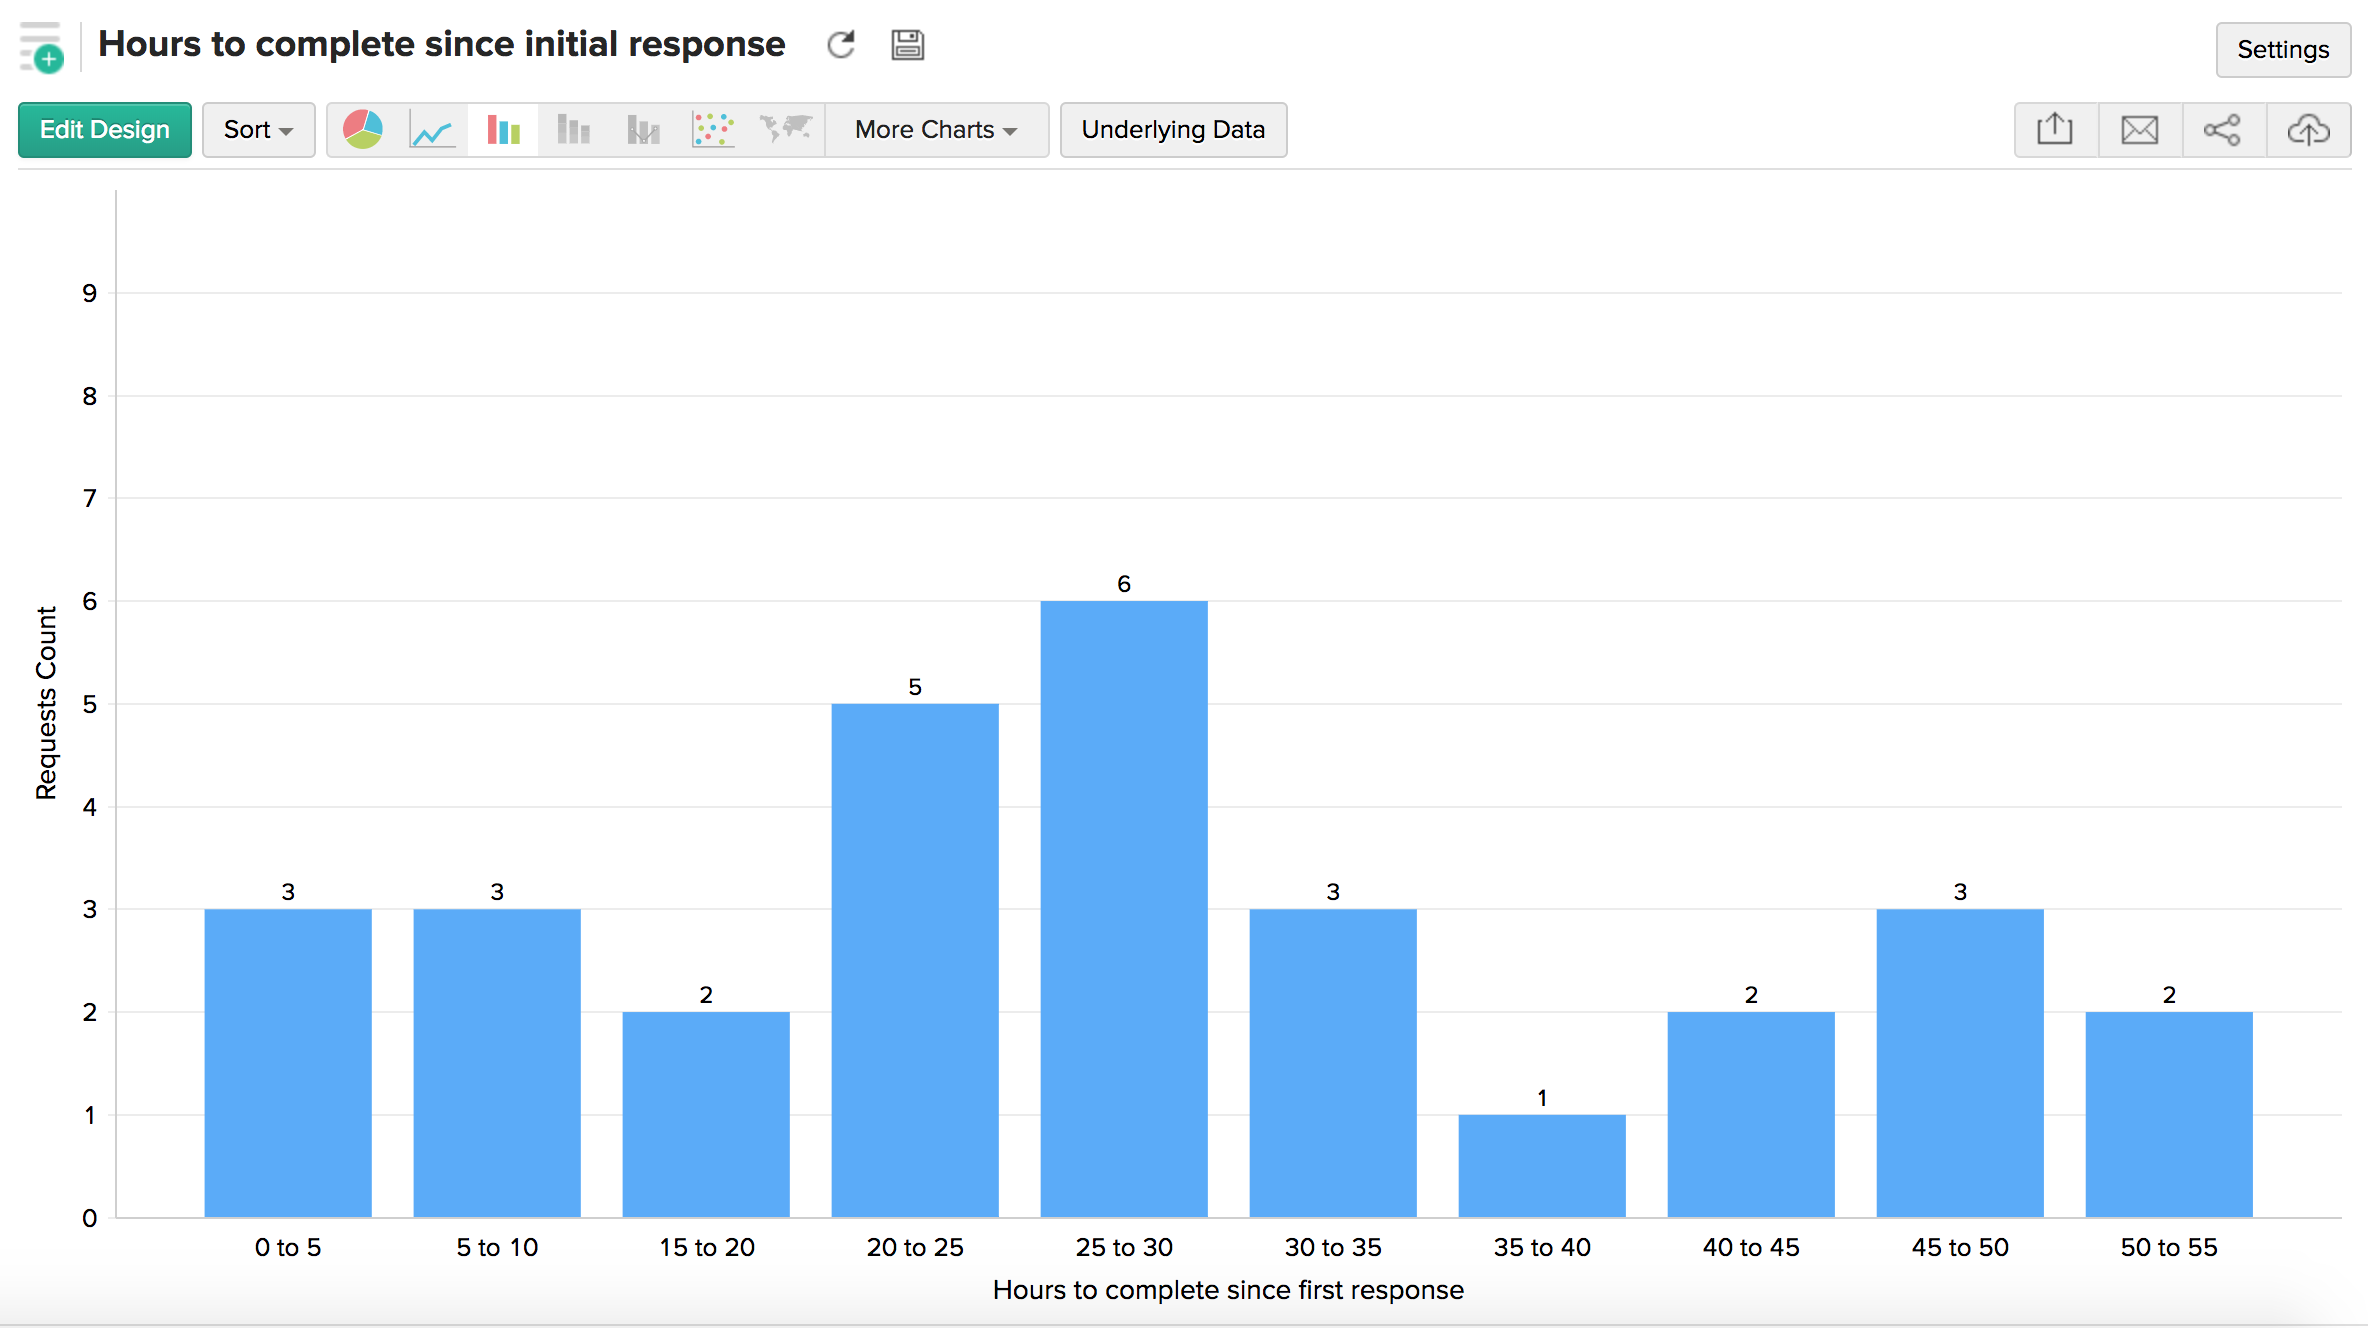
This is a simple metric you can monitor using Analytics Plus. To simplify the report, I've split the x-axis into 5-hour ranges. For instance, this report shows that there are 3 requests that were resolved within 5 hours of first response, and 3 requests resolved between 5-10 hours of first response, etc., Splitting the x-axis by 5-hour ranges helps keep the report clean and uncluttered.
This report is available by default when you integrate ServiceDesk Plus with Analytics Plus. Click here to view the interactive version. If you wish to create this report on your own, just fill your fields as given below:
X-axis: Hours to complete since initial response (Actual - Range > Range size: 5)
Y-Axis: Request ID (Count)
You need this custom formula to create the 'hours to complete since initial response' column:
dateandtimediff(HOUR, "Responded Time", "Completed Time")
Filters:
Request pending status (Actual) - Include 'No'
Hours to complete (Actual) - Exclude >50 hours
Click here
to check out more interesting reports and dashboards that can help you get an in-depth look into your help desk processes.
