Database Query Monitoring Has Been Enhanced!
Have you ever felt that you needed to monitor more than just the default attributes in your SAP HANA and SAP MaxDB databases? Well, now you can, because ManageEngine Applications Manager now supports Database Query Monitoring of SAP HANA and SAP MaxDB.
When you add a SAP HANA or SAP MaxDB database monitor, you can monitor only a predefined set of attributes by default. With a database query monitor, you can execute a set of queries and analyse the result. The new enhancement of database query monitor allows you to give customized queries to be monitored in SAP HANA and SAP MaxDB.
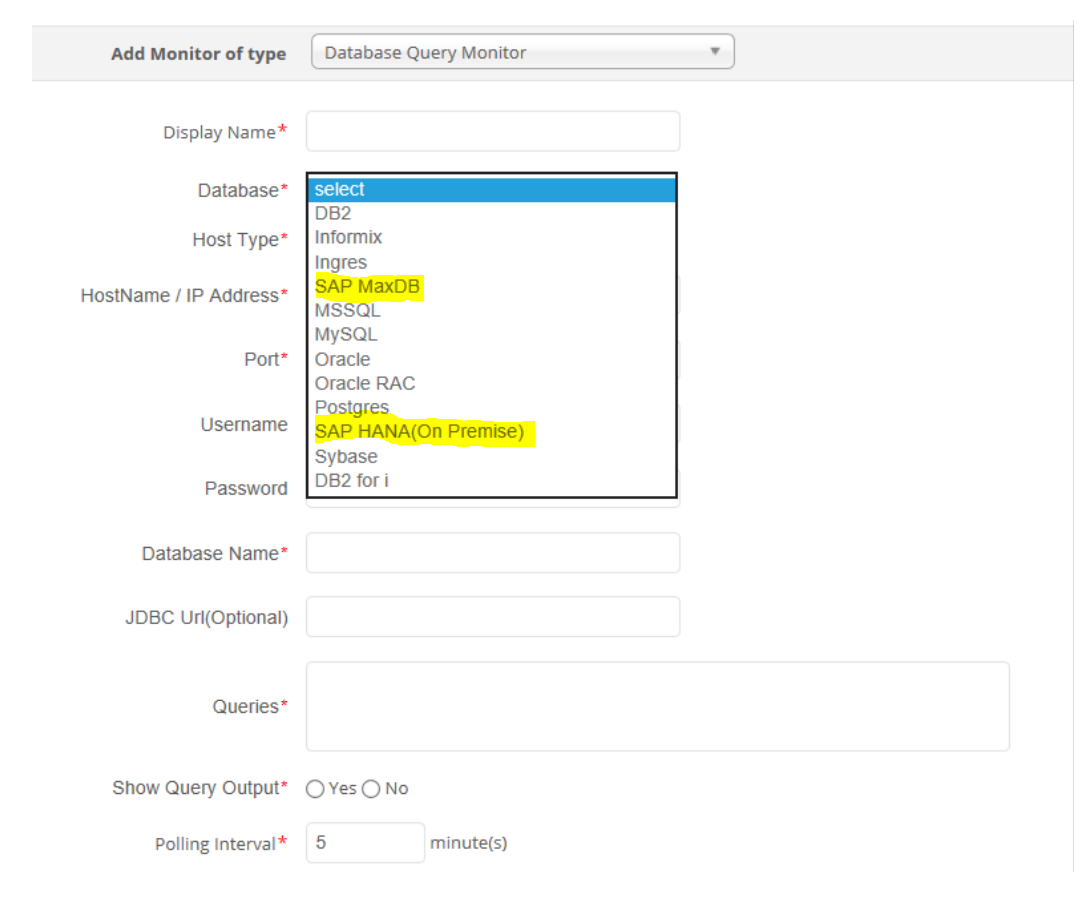
How to add database query monitor for SAP HANA/SAP MaxDB:
- When you go to New Monitor> Add New Monitor> Database Query Monitor(under custom monitors), you'll land on a page as shown above. Alternatively, you can also add a monitor using Add/Discovery option from the Admin tab.
- Select SAP MaxDB/ SAP HANA(On Premise) and enter all the other credentials and queries.
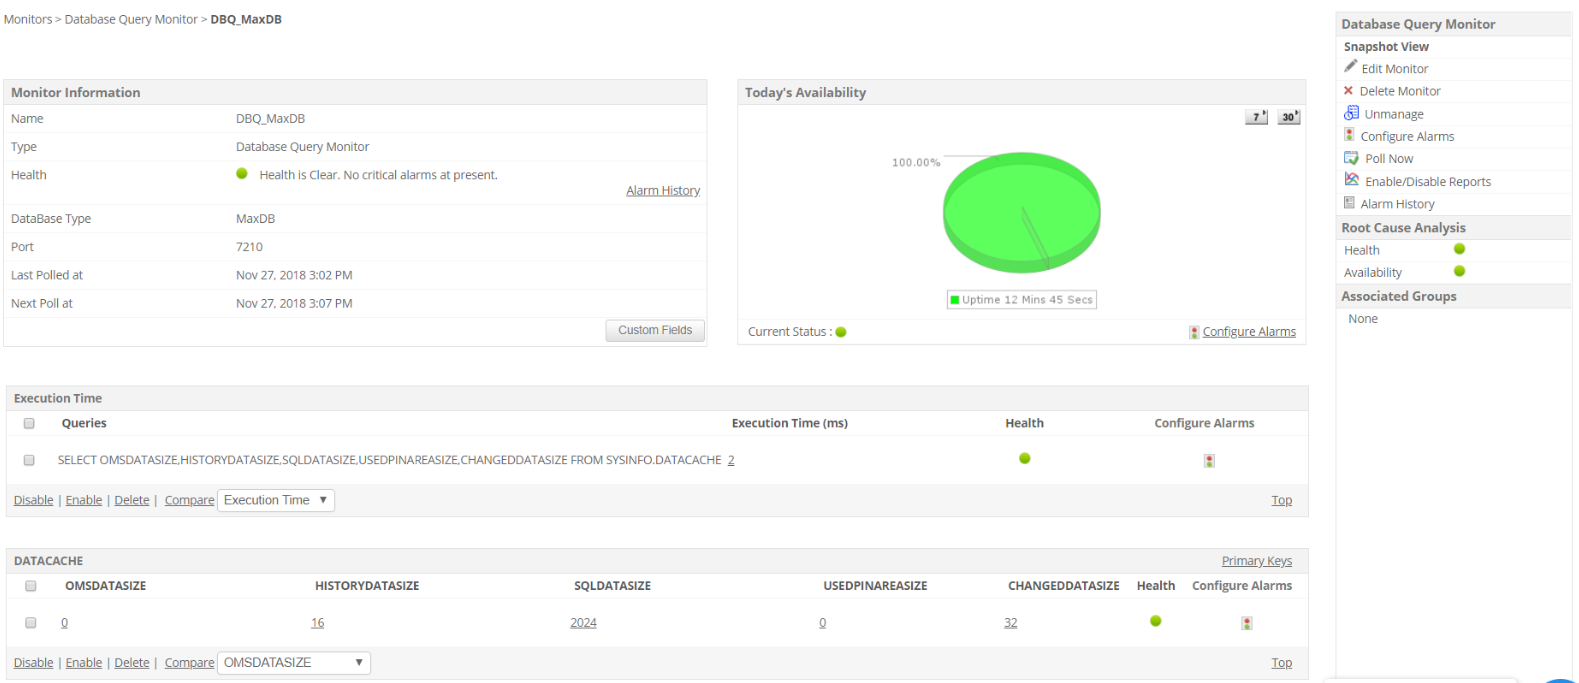
After adding the monitor, Applications Manager executes the queries and displays the output. When you click on the monitor name, you'll see the availability status, health and the execution time of the query. Moreover, you can automate this process by fixing the polling interval, which, by default, is set as 5 minutes.
Note
: The database query monitor currently supports only the on premise version of SAP HANA database.
We believe this little tweak could be useful when you monitor SAP HANA and SAP MaxDB. Feel free to try this out and let us know your thoughts!
