Cannot connect monitors to the snapshot dial graphs for new device template
Hi,
I am using OpManager 8.22 that I am currently customizing by adding templates for our own HW.
I have been reading the forum now for several days to try to enable the CPU utilization graph for this custom devices.
This is what I have done so far:
1. Created new category - RLSgroup
2. Created a new device template - SatLink RLS-85XX - inserted in the RLSgroup category
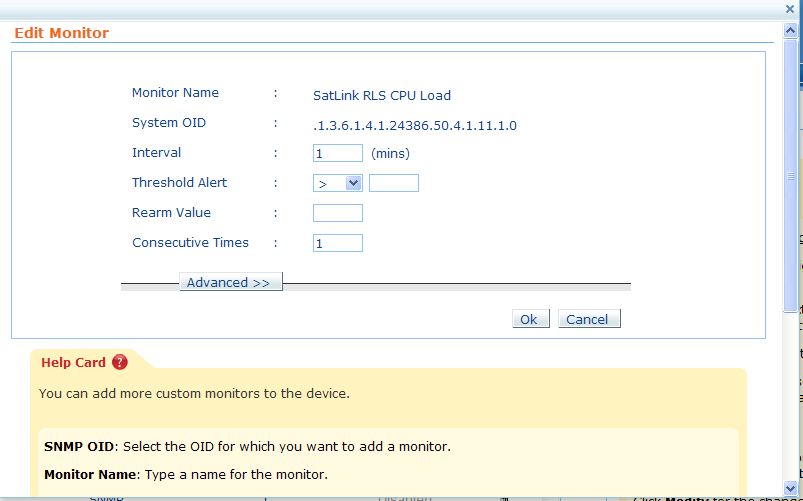
3. Added monitors to the SatLink RLS-85XX device template. Verified that the monitors are working correctly.
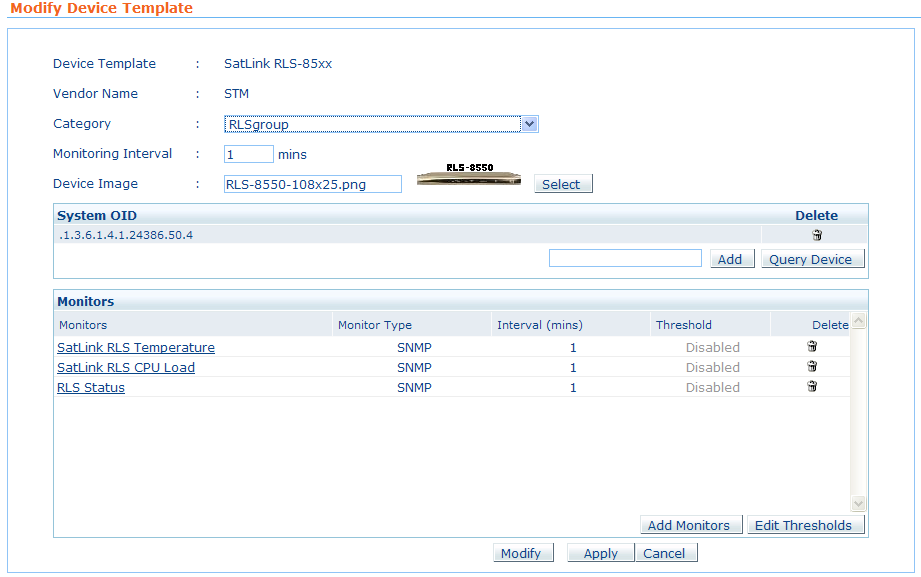
My problem now is that I have not been successful connecting the monitors to the snapshot dial graphs for CPU, memory and temperature.
To try to get the graphs inserted I added the following in opmanager_snapshot_dial.xml:
<CATEGORY name="RLSgroup">
<DIAL name="CPUUtilization" displayName="webclient.devices.details.cpu" dialType="meter" shortKey="CPU" unit="%">
<PARAM type="SatLink RLS-85xx" pollKey="SatLink RLS CPU Load"/>
<DEFAULT pollKey="CPUUtilization"/>
</DIAL>
<DIAL name="MemoryUtilization" displayName="webclient.devices.details.mem" dialType="meter" shortKey="Memory" unit="%">
<PARAM type="SatLink RLS-85xx" pollKey="RLS Status"/>
<DEFAULT pollKey="RLS Status"/>
</DIAL>
<DIAL name="Temperature" displayName="webclient.devices.details.temperature" dialType="number" shortKey="Temp" unit="C">
<PARAM type="SatLink RLS-85xx" pollKey="SatLink RLS Temperature"/>
<DEFAULT pollKey="SatLink RLS Temperature"/>
</DIAL>
</CATEGORY>
Any suggestion to other changes needed or what I have done wrong?
Best regards
Terje N.
