2023: A feature retrospective
1. Powerful integrations:
- OpManager MSP: Gain complete insights into performance metrics, utilization, alarms, and more to streamline network management for multiple clients.
- Key Manager Plus: Streamline SSH key and SSL management, enhance security, and optimize access to credentials.
- Google Analytics 4: Leverage insightful reports on web traffic KPIs, to effortlessly optimize SEO and SEM campaigns.
- Nagios XI: Visualize the entire IT infrastructure with detailed insights into network performance, system health, incident trends, infrastructure forecasts, and more.
- Ivanti Neurons: Drive continuous optimization of IT operations by evaluating key business objects such as incidents, changes, projects, releases, and more.
- Splunk: Transform complex machine-generated big data into insightful dashboards, simplifying the tracking and analysis of critical information from websites, applications, servers, networks, and mobile devices.
- Freshdesk: Enhance help desk productivity by tracking key metrics such as ticket volume, response time, resolution time, and customer satisfaction.
- Endpoint Central MSP: Efficiently track and gain in-depth insights into all managed devices in a unified view.
- Mobile Device Manager Plus MSP: Enhance security of mobile device management for multiple accounts from a unified console by accessing detailed insights on device usage, compliance, alerts, security incidents, and more.
2. Enhancements to existing integrations
- OpManager: Introduced support for URL Monitors, URL Performance Details, and URL Availability History modules.
- SupportCenter Plus: Enhance customer support by delving deeper into reports on techperformance feedback, end user satisfaction, ticket closures, and more.
3. Additional data import options
Analytics Plus offers extended import options, providing seamless access to data from diverse sources. This includes Apache Derby local databases, Azure Data Lake (supporting containers, file shares, and tables), Microsoft Sharepoint, and a broader range of local and cloud databases, such as H2, CUBRID, HyperSQL, and SingleStore.
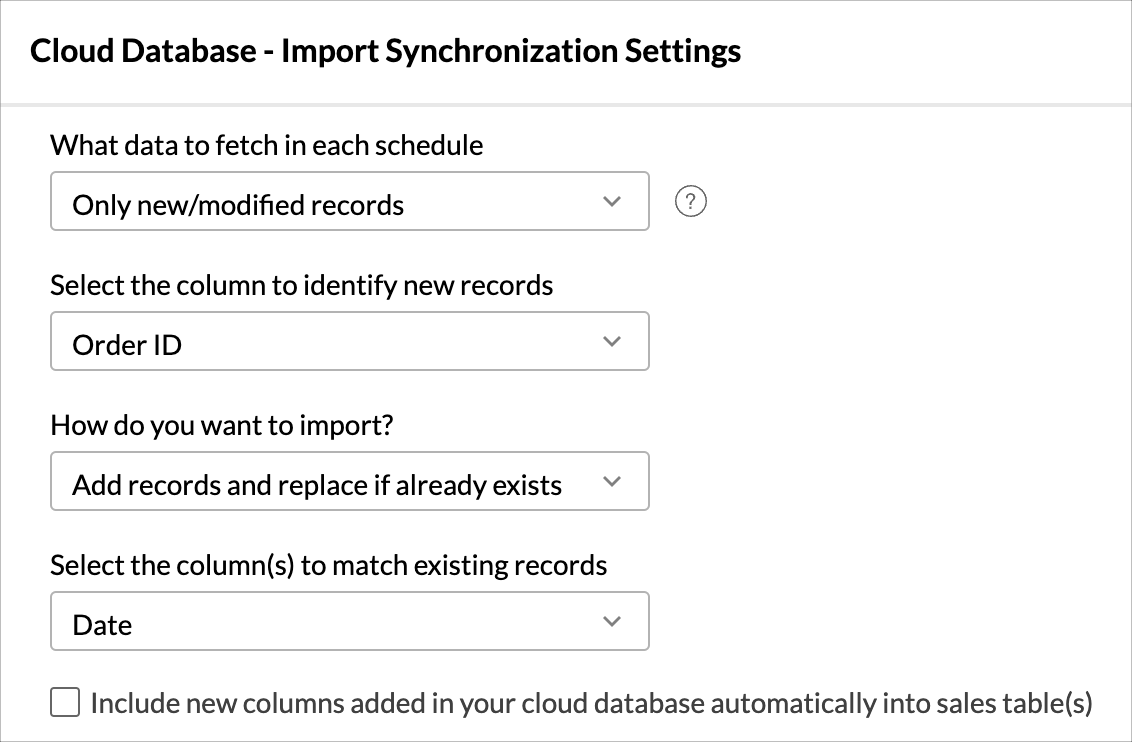
4. Incremental fetch for databases
5. Ask Zia: The smart assistant levels up!
Follow-up questions in Ask Zia: Zia now suggests follow-up questions in both normal and conversation modes, simplifying the process of analyzing the data in-depth.
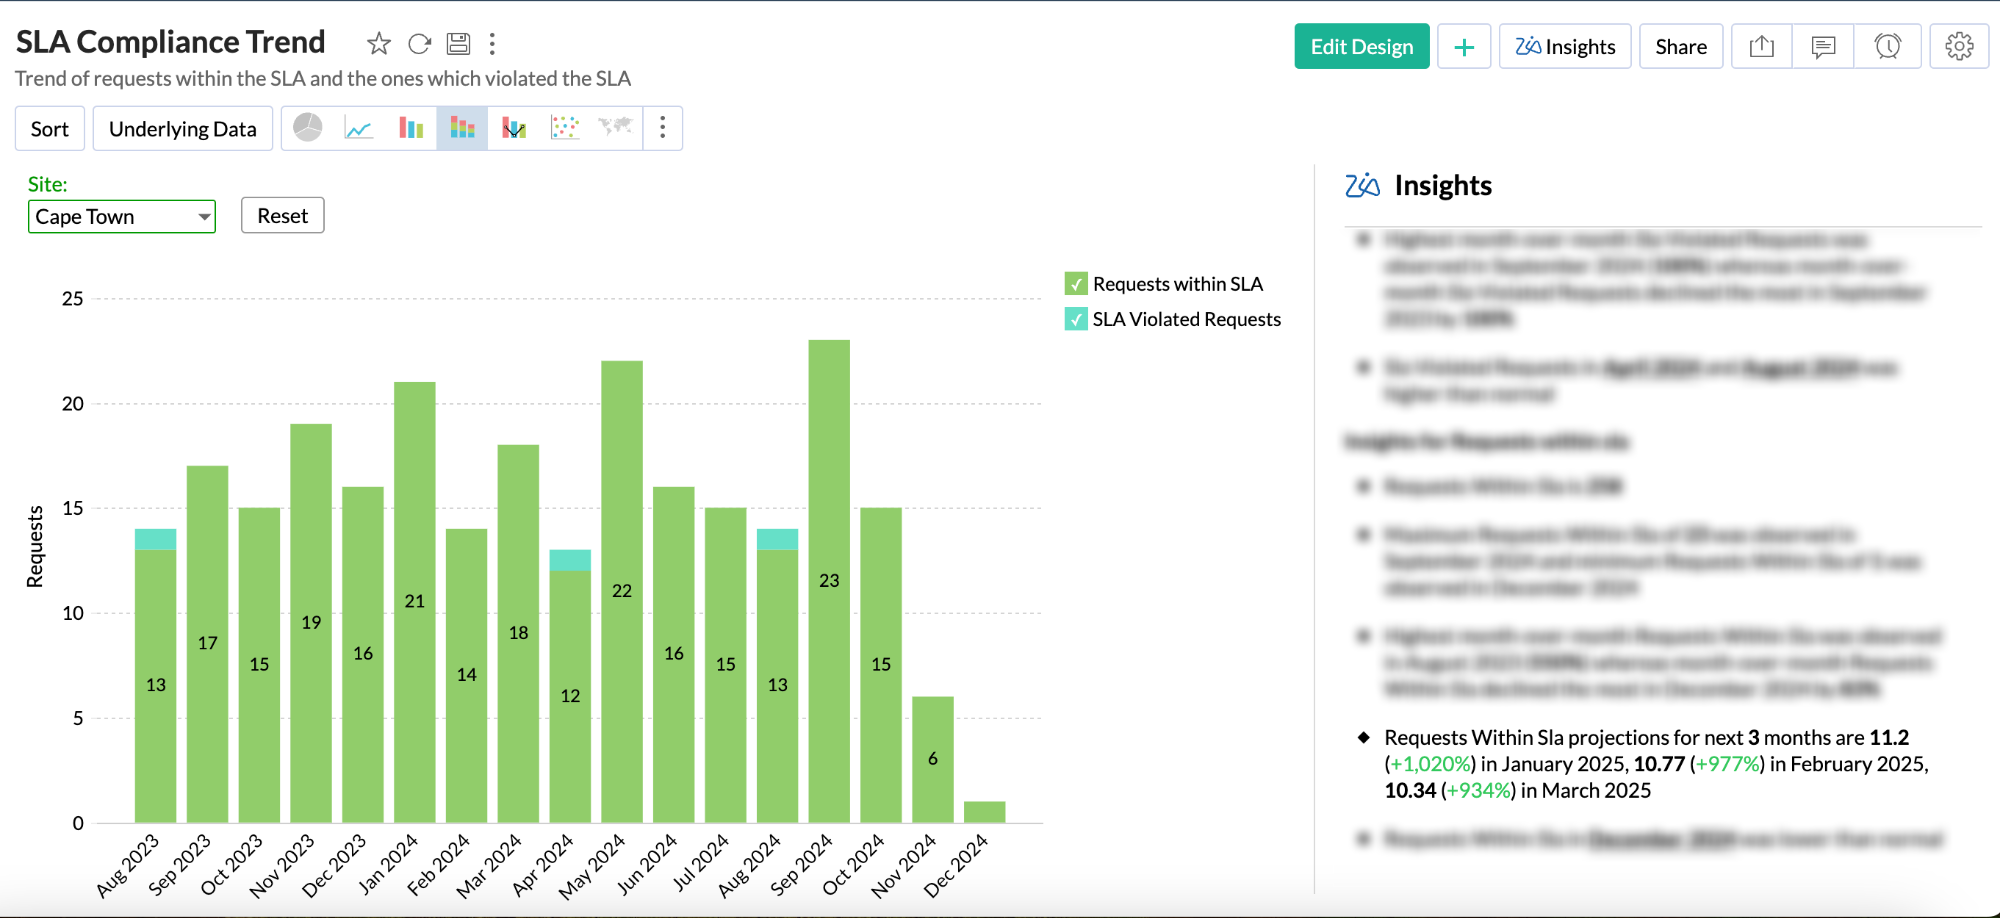
Zia Insights provides predictions: In addition to providing narrative insights Zia includes future projections on key metrics.
Embed Zia in intranet applications: Streamline workflow and interruption-free user experience by embedding Ask Zia in other IT apps without toggling between multiple apps.
Explain Data: Zia Insights helps identify significant changes or anomalies by providing detailed insights on specific data points in a report.
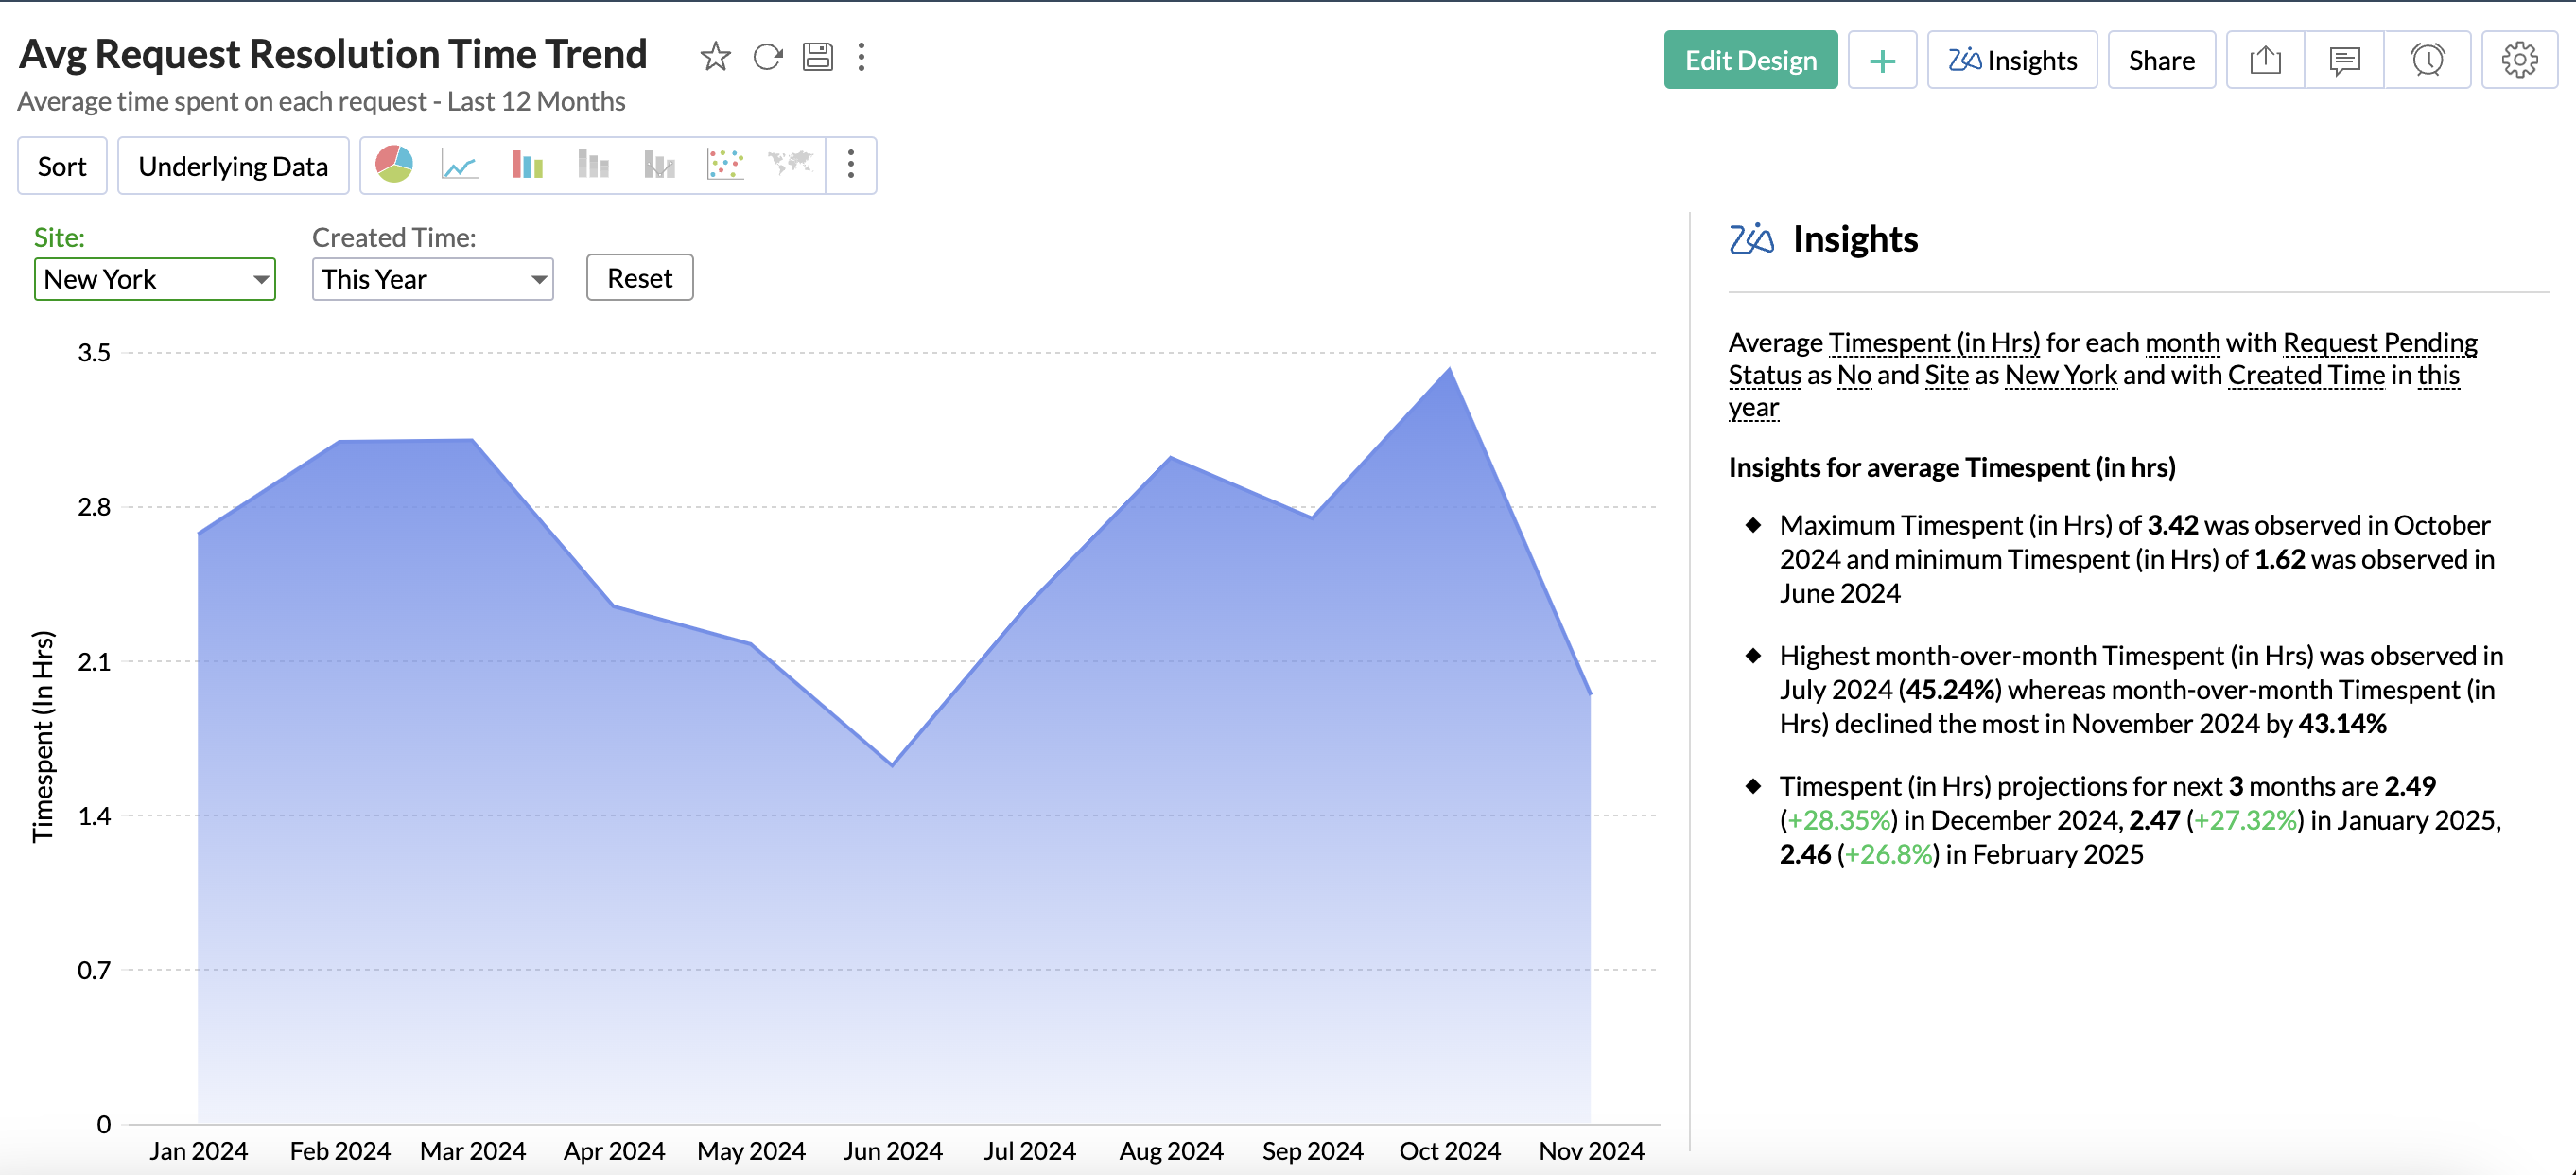
Add Ask Zia-generated reports to dashboards: Now, effortlessly add Ask Zia-generated reports to dashboards by simply dragging and dropping them, offering seamless integration of natural language conversations and analytical insights.
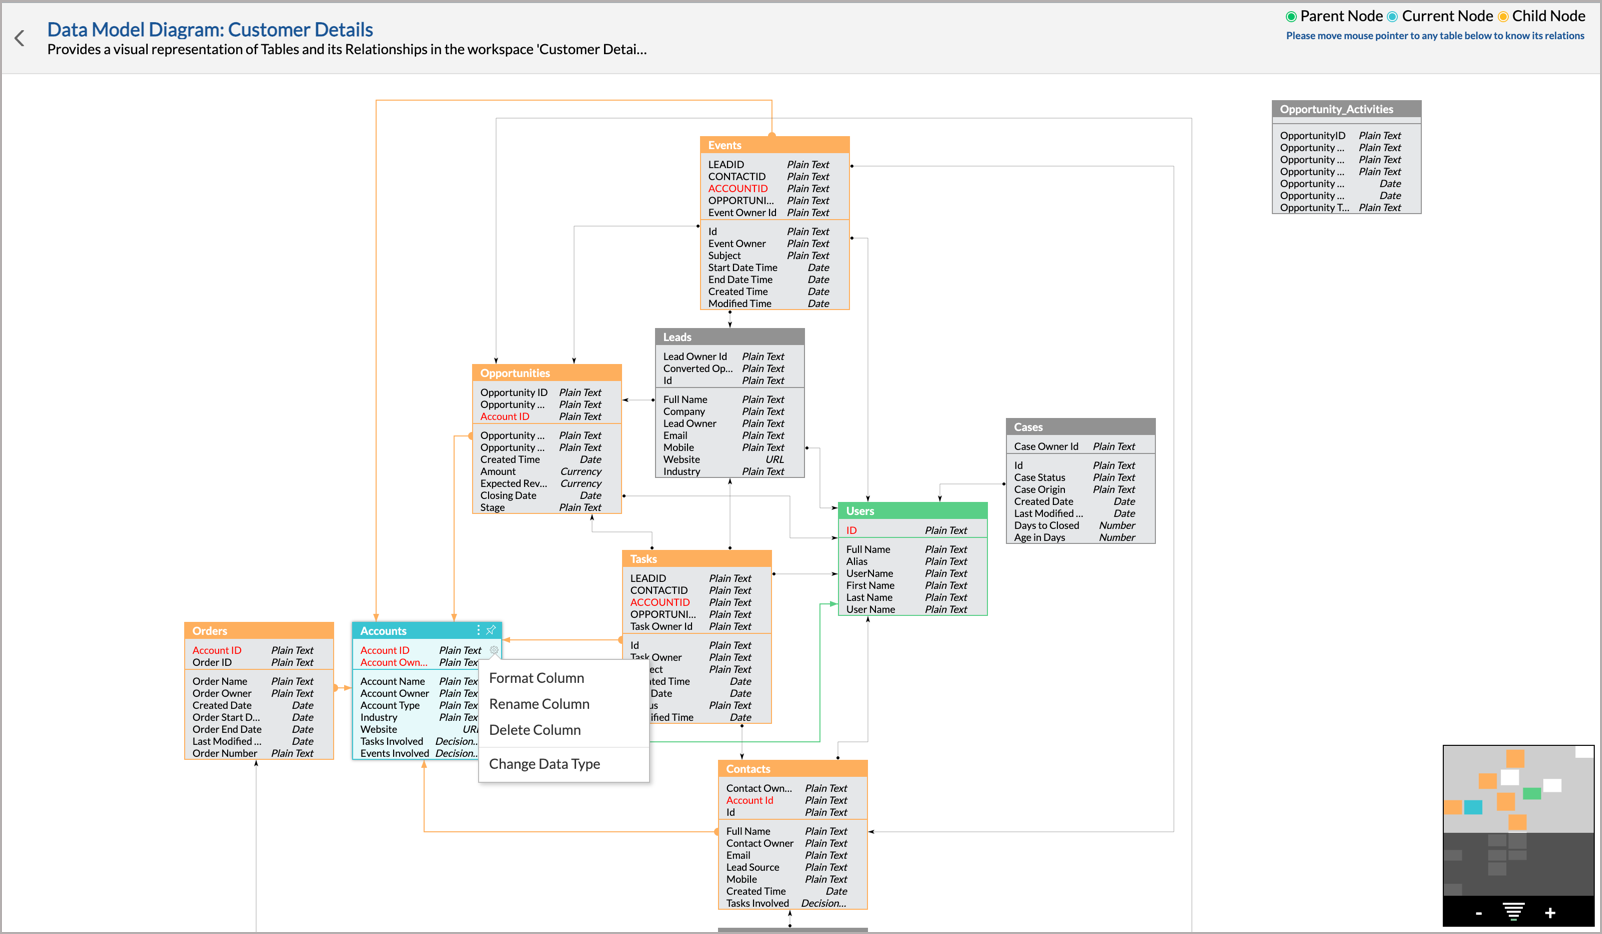
6. Data-Model Diagram:
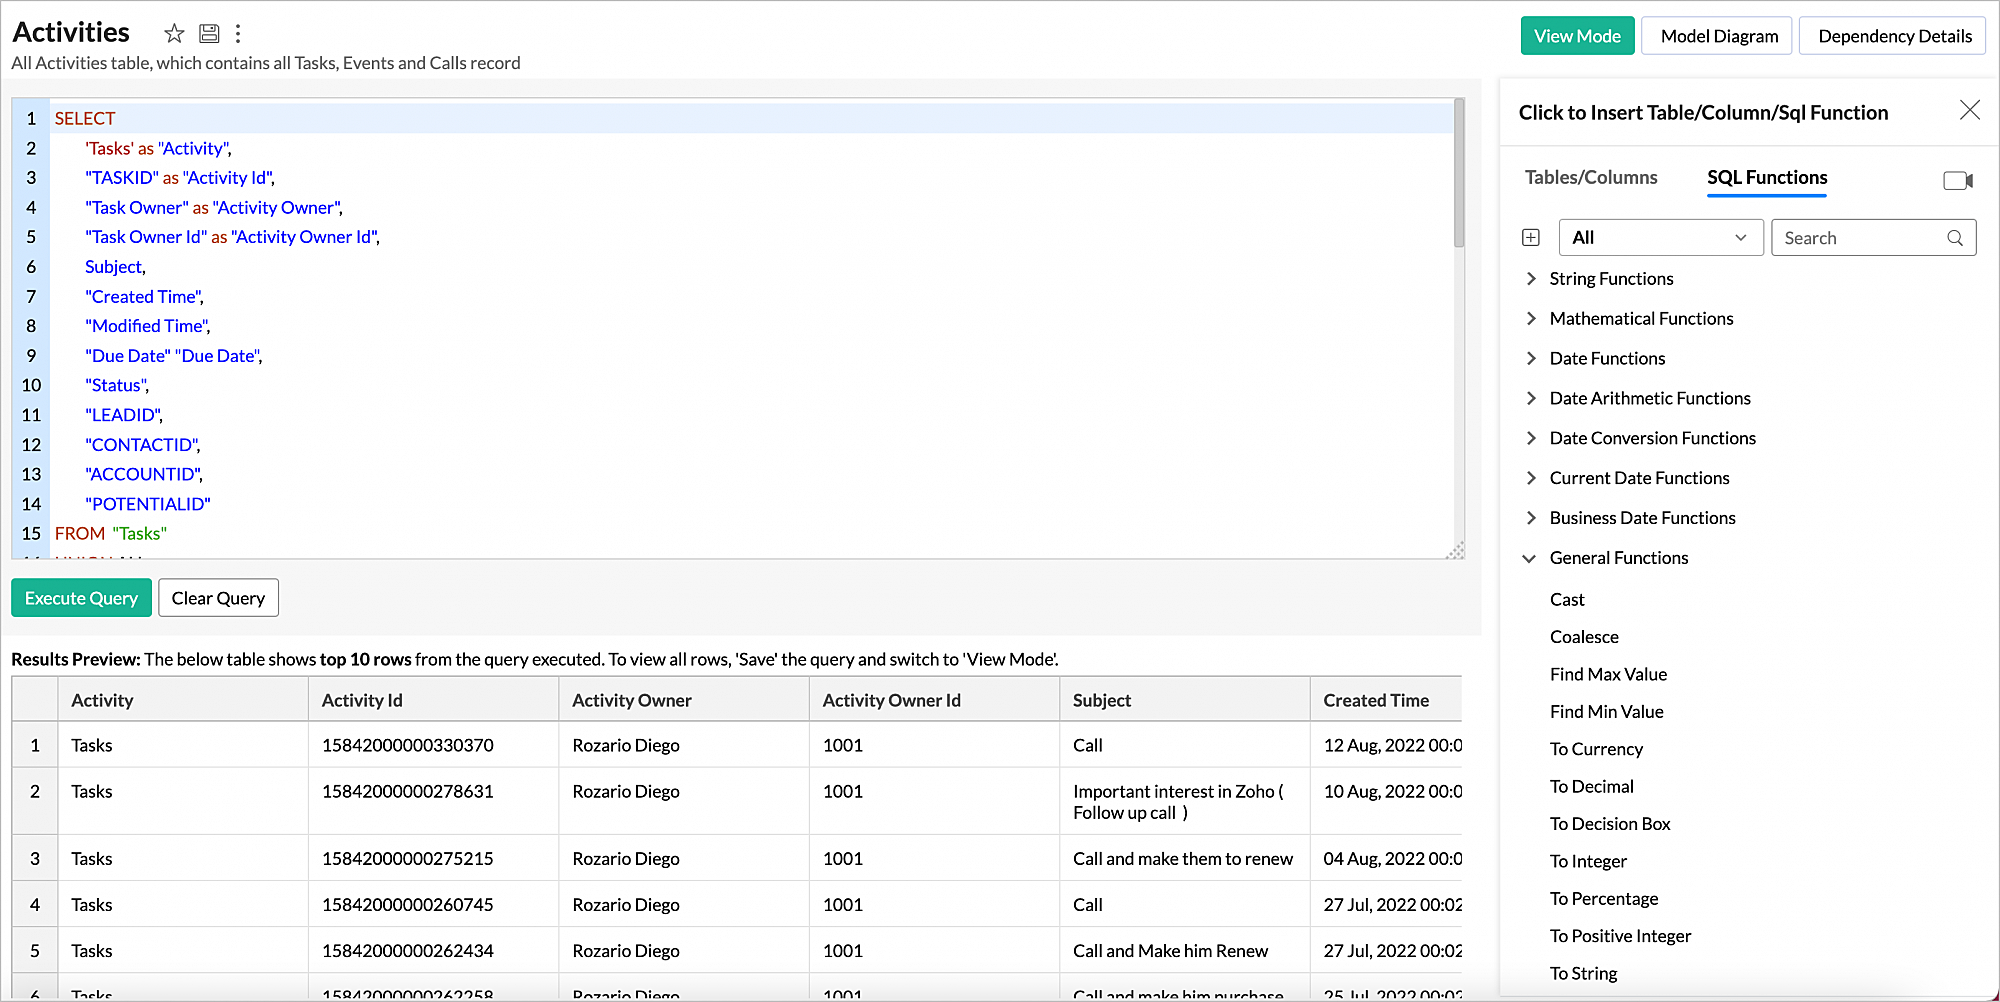
7. Query Table: Enhanced UI and innovative functions
8. Enriched geo-visualizations
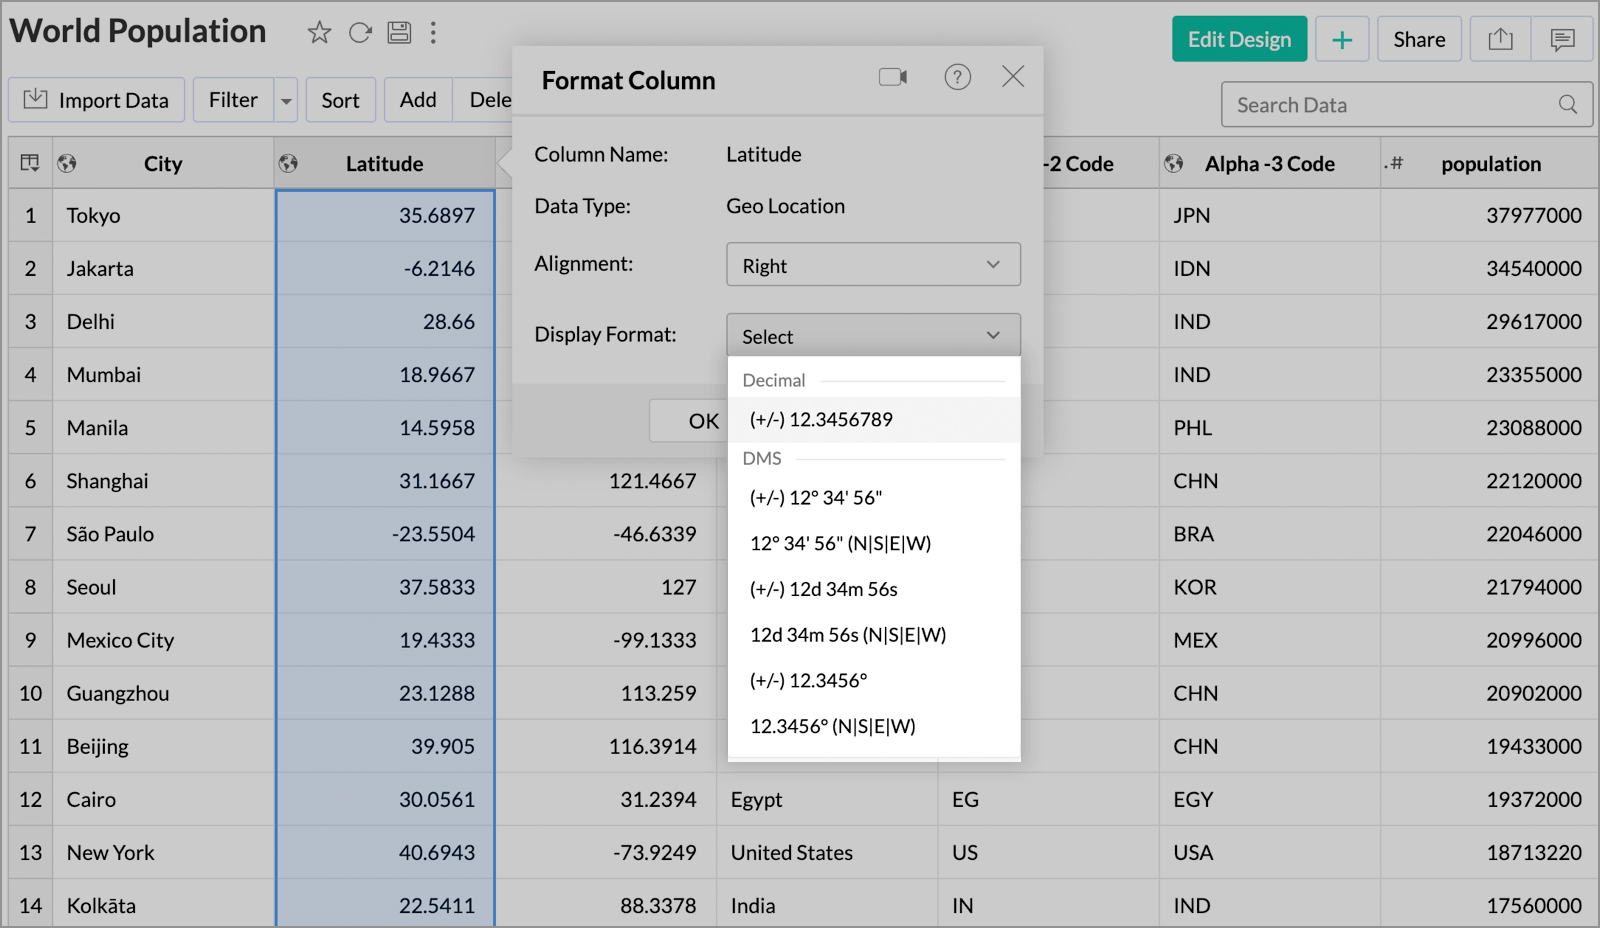
9. Sleeker tabular views
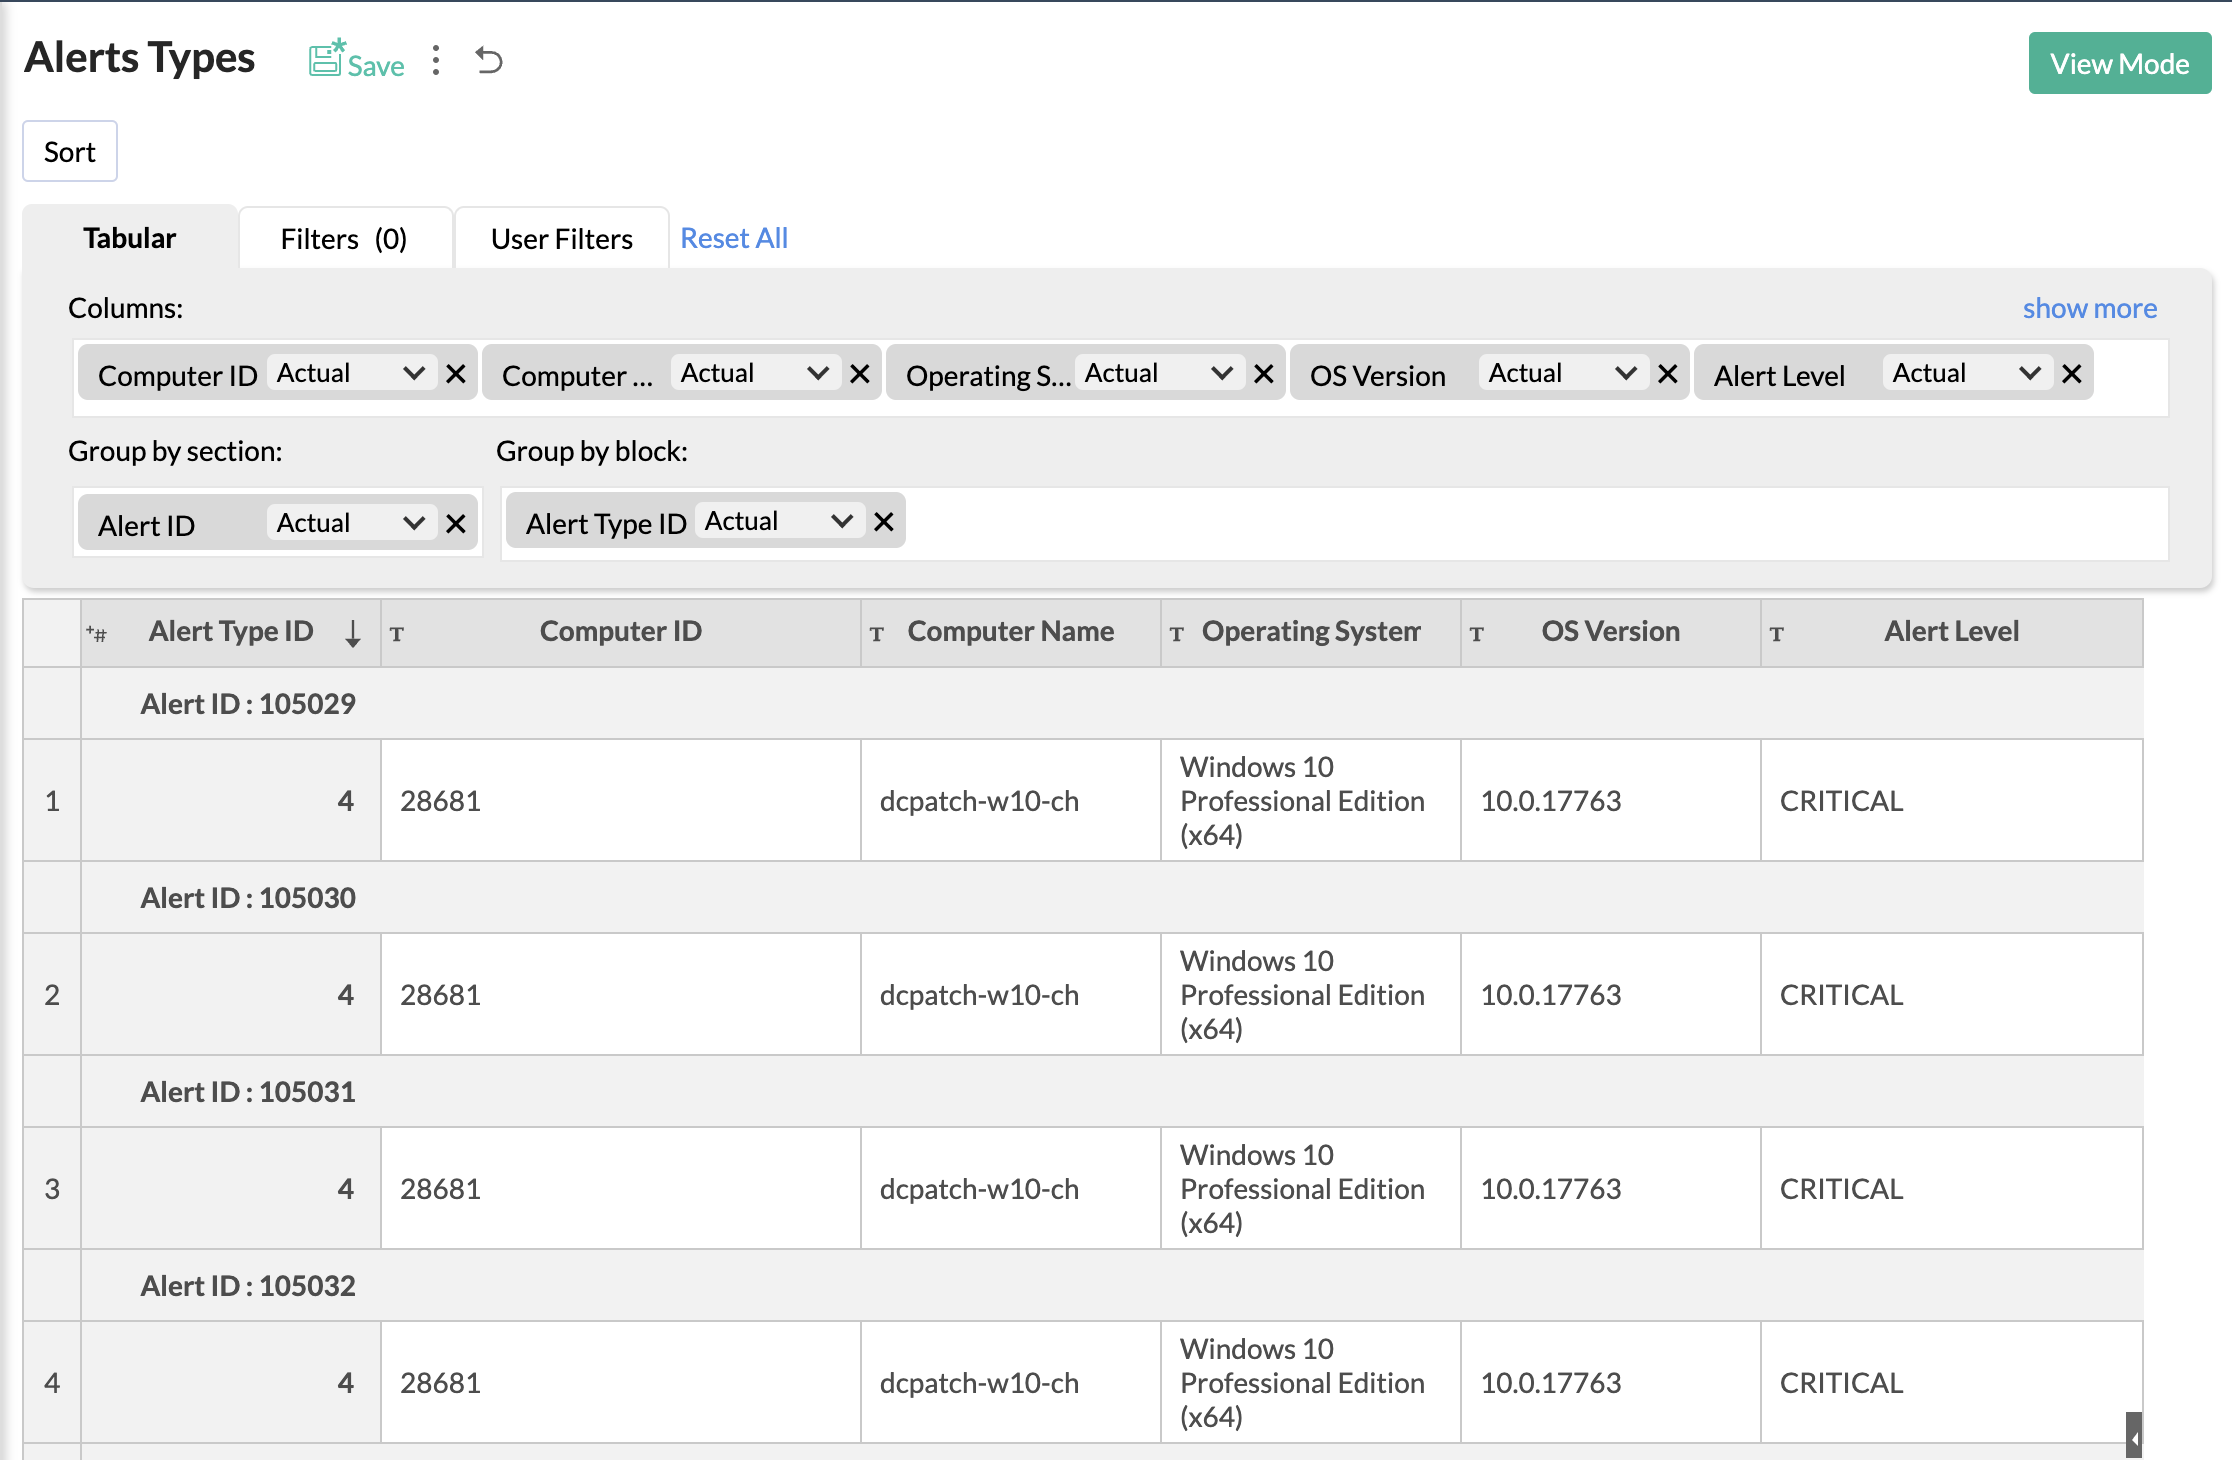
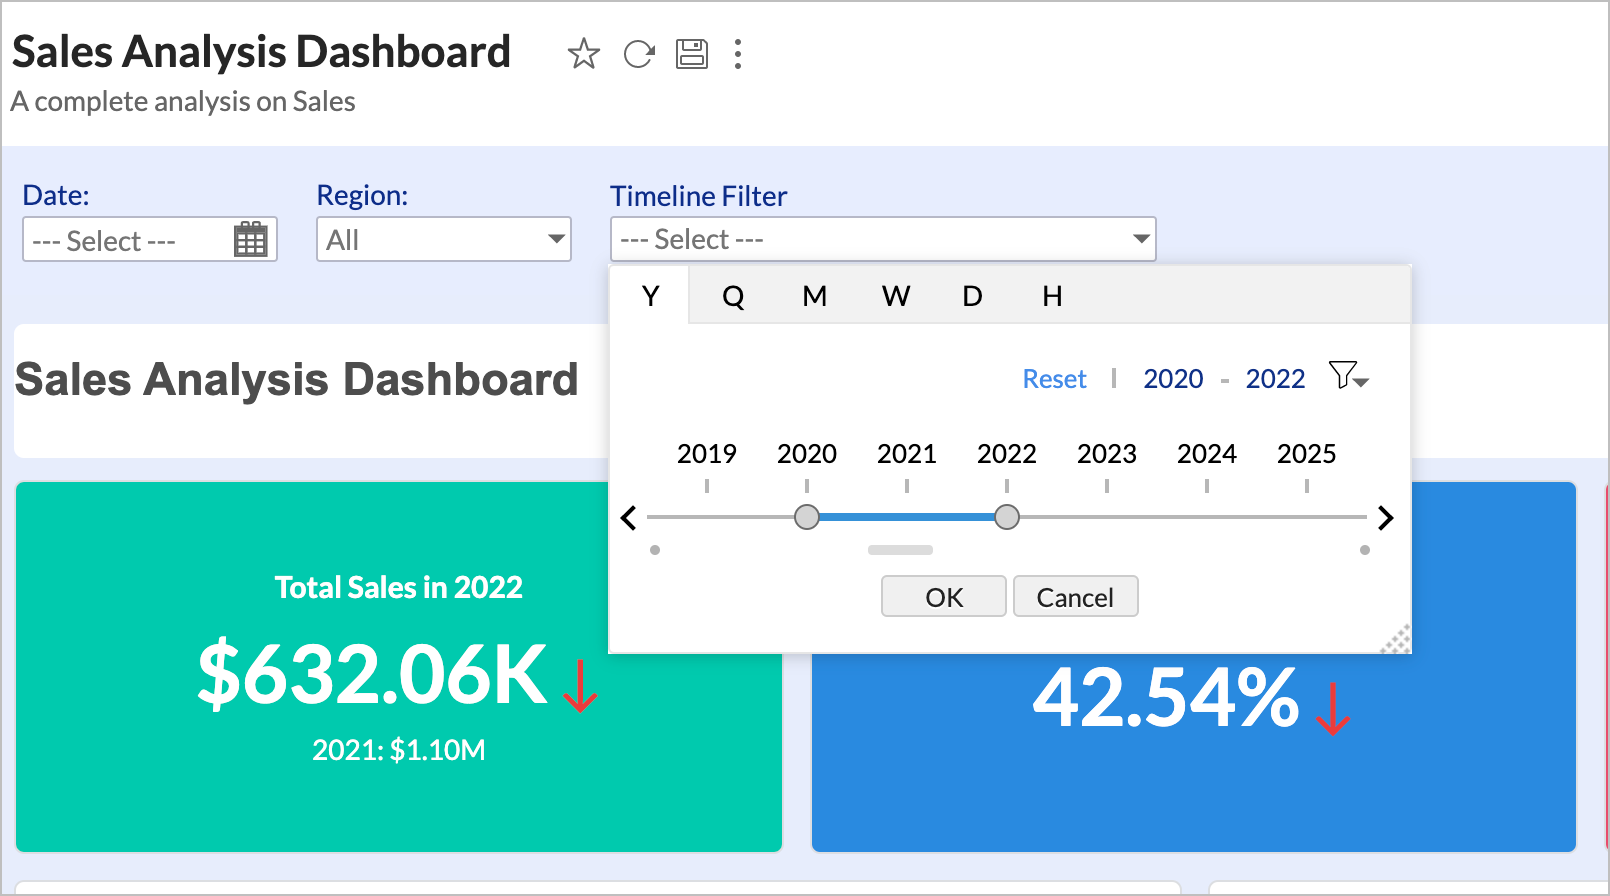
10. Enhanced dashboards with time slicer in timeline filters
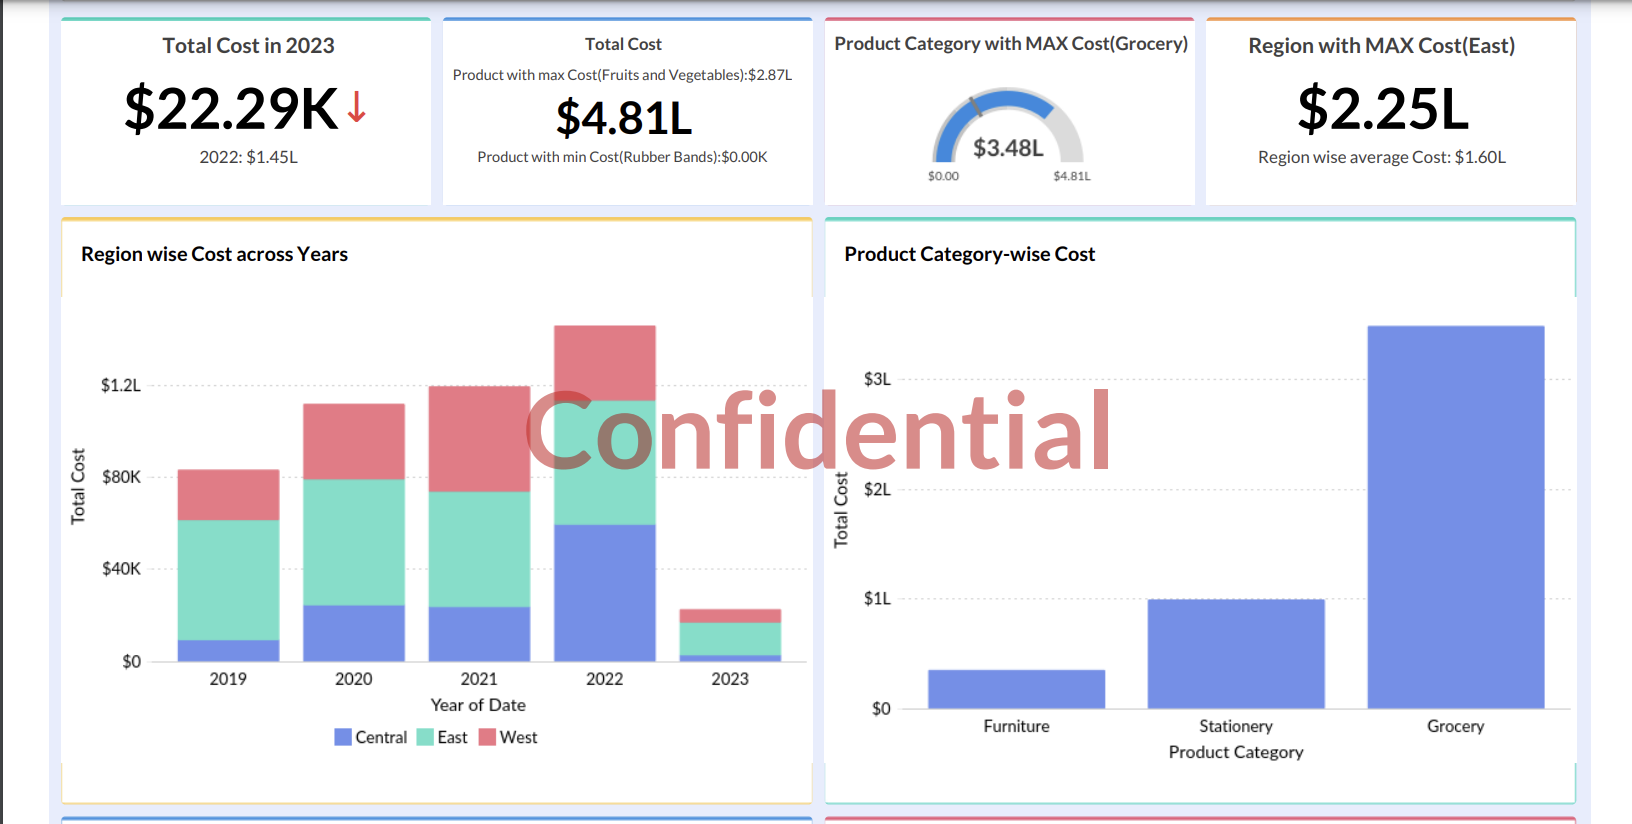
11. Export with a watermark
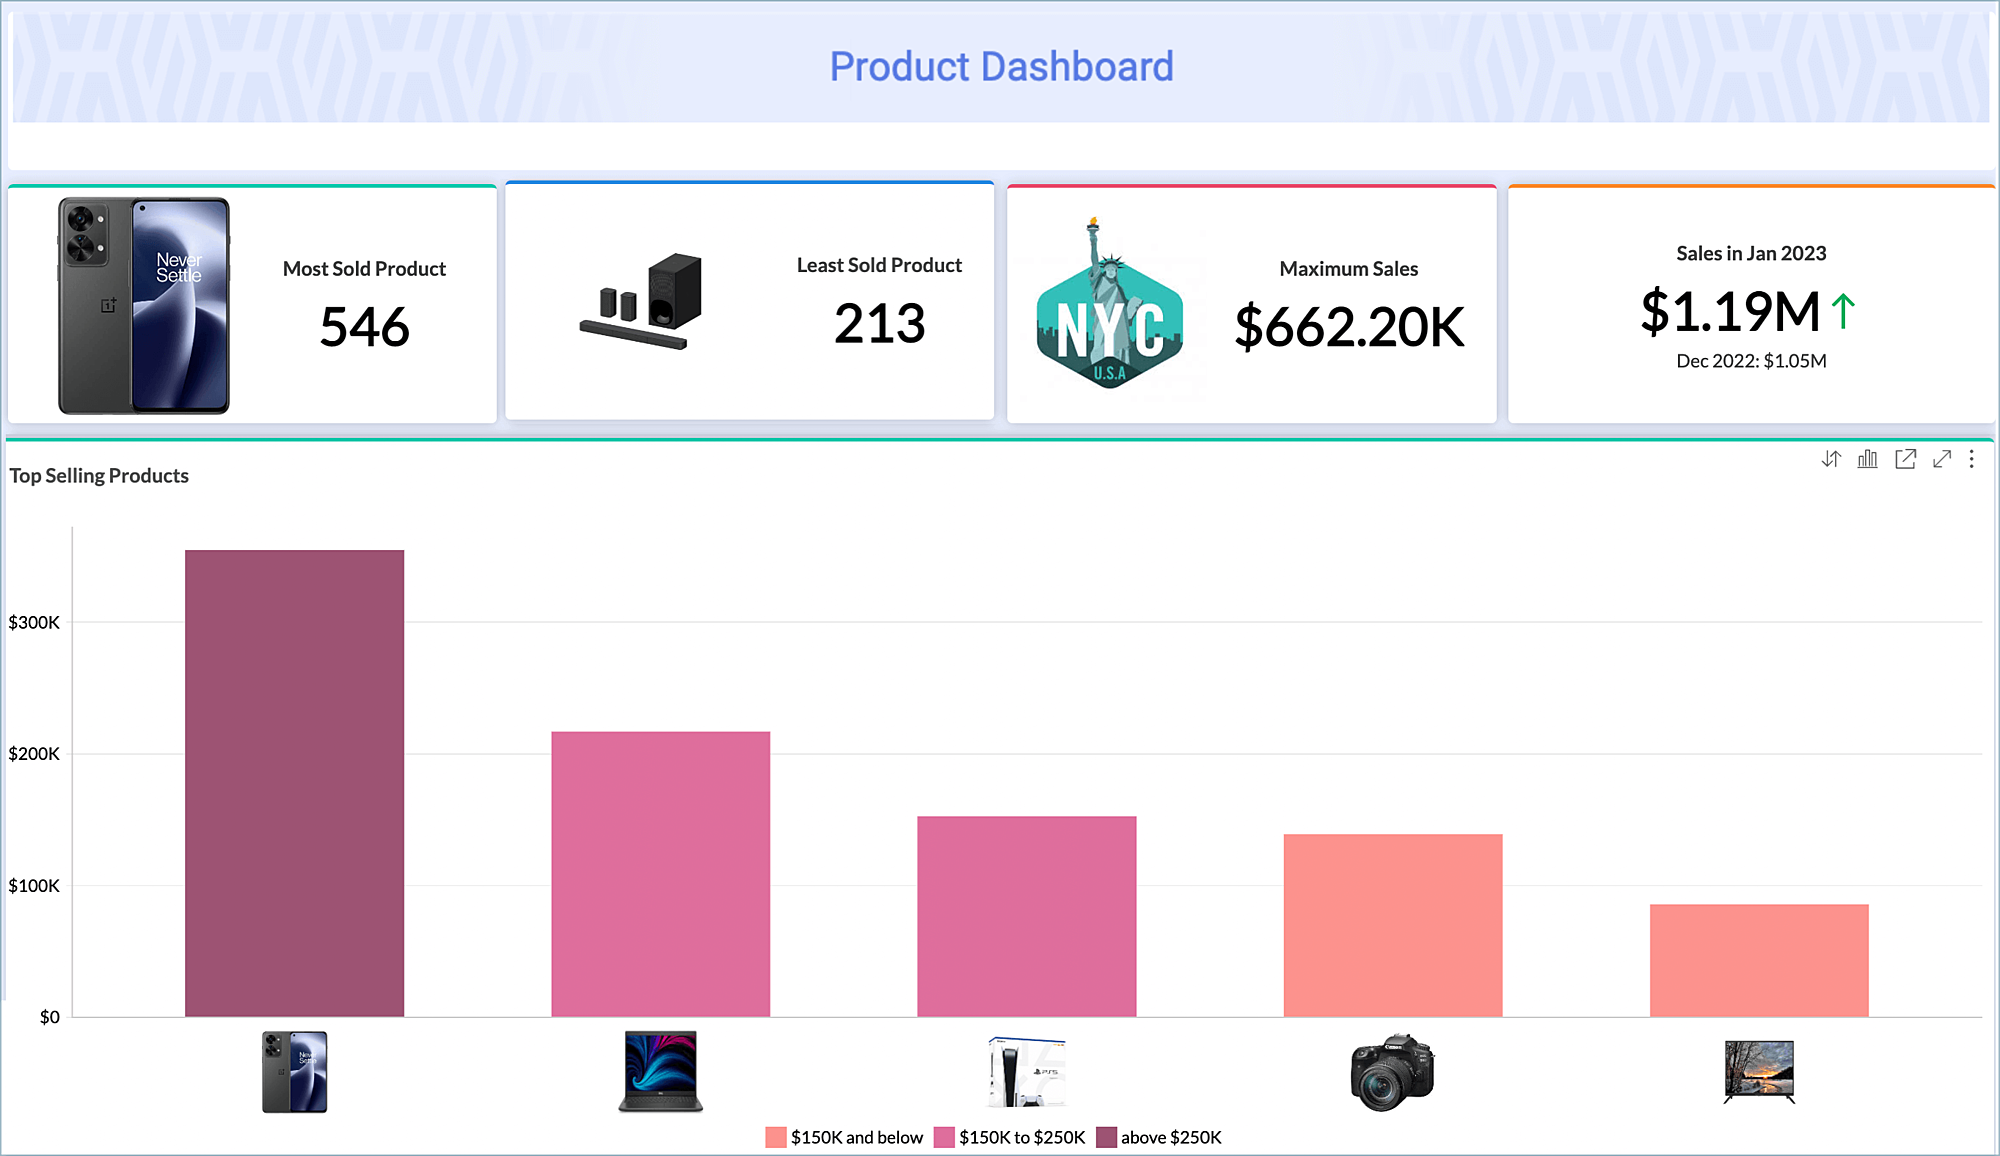
12. Image support for KPI widgets
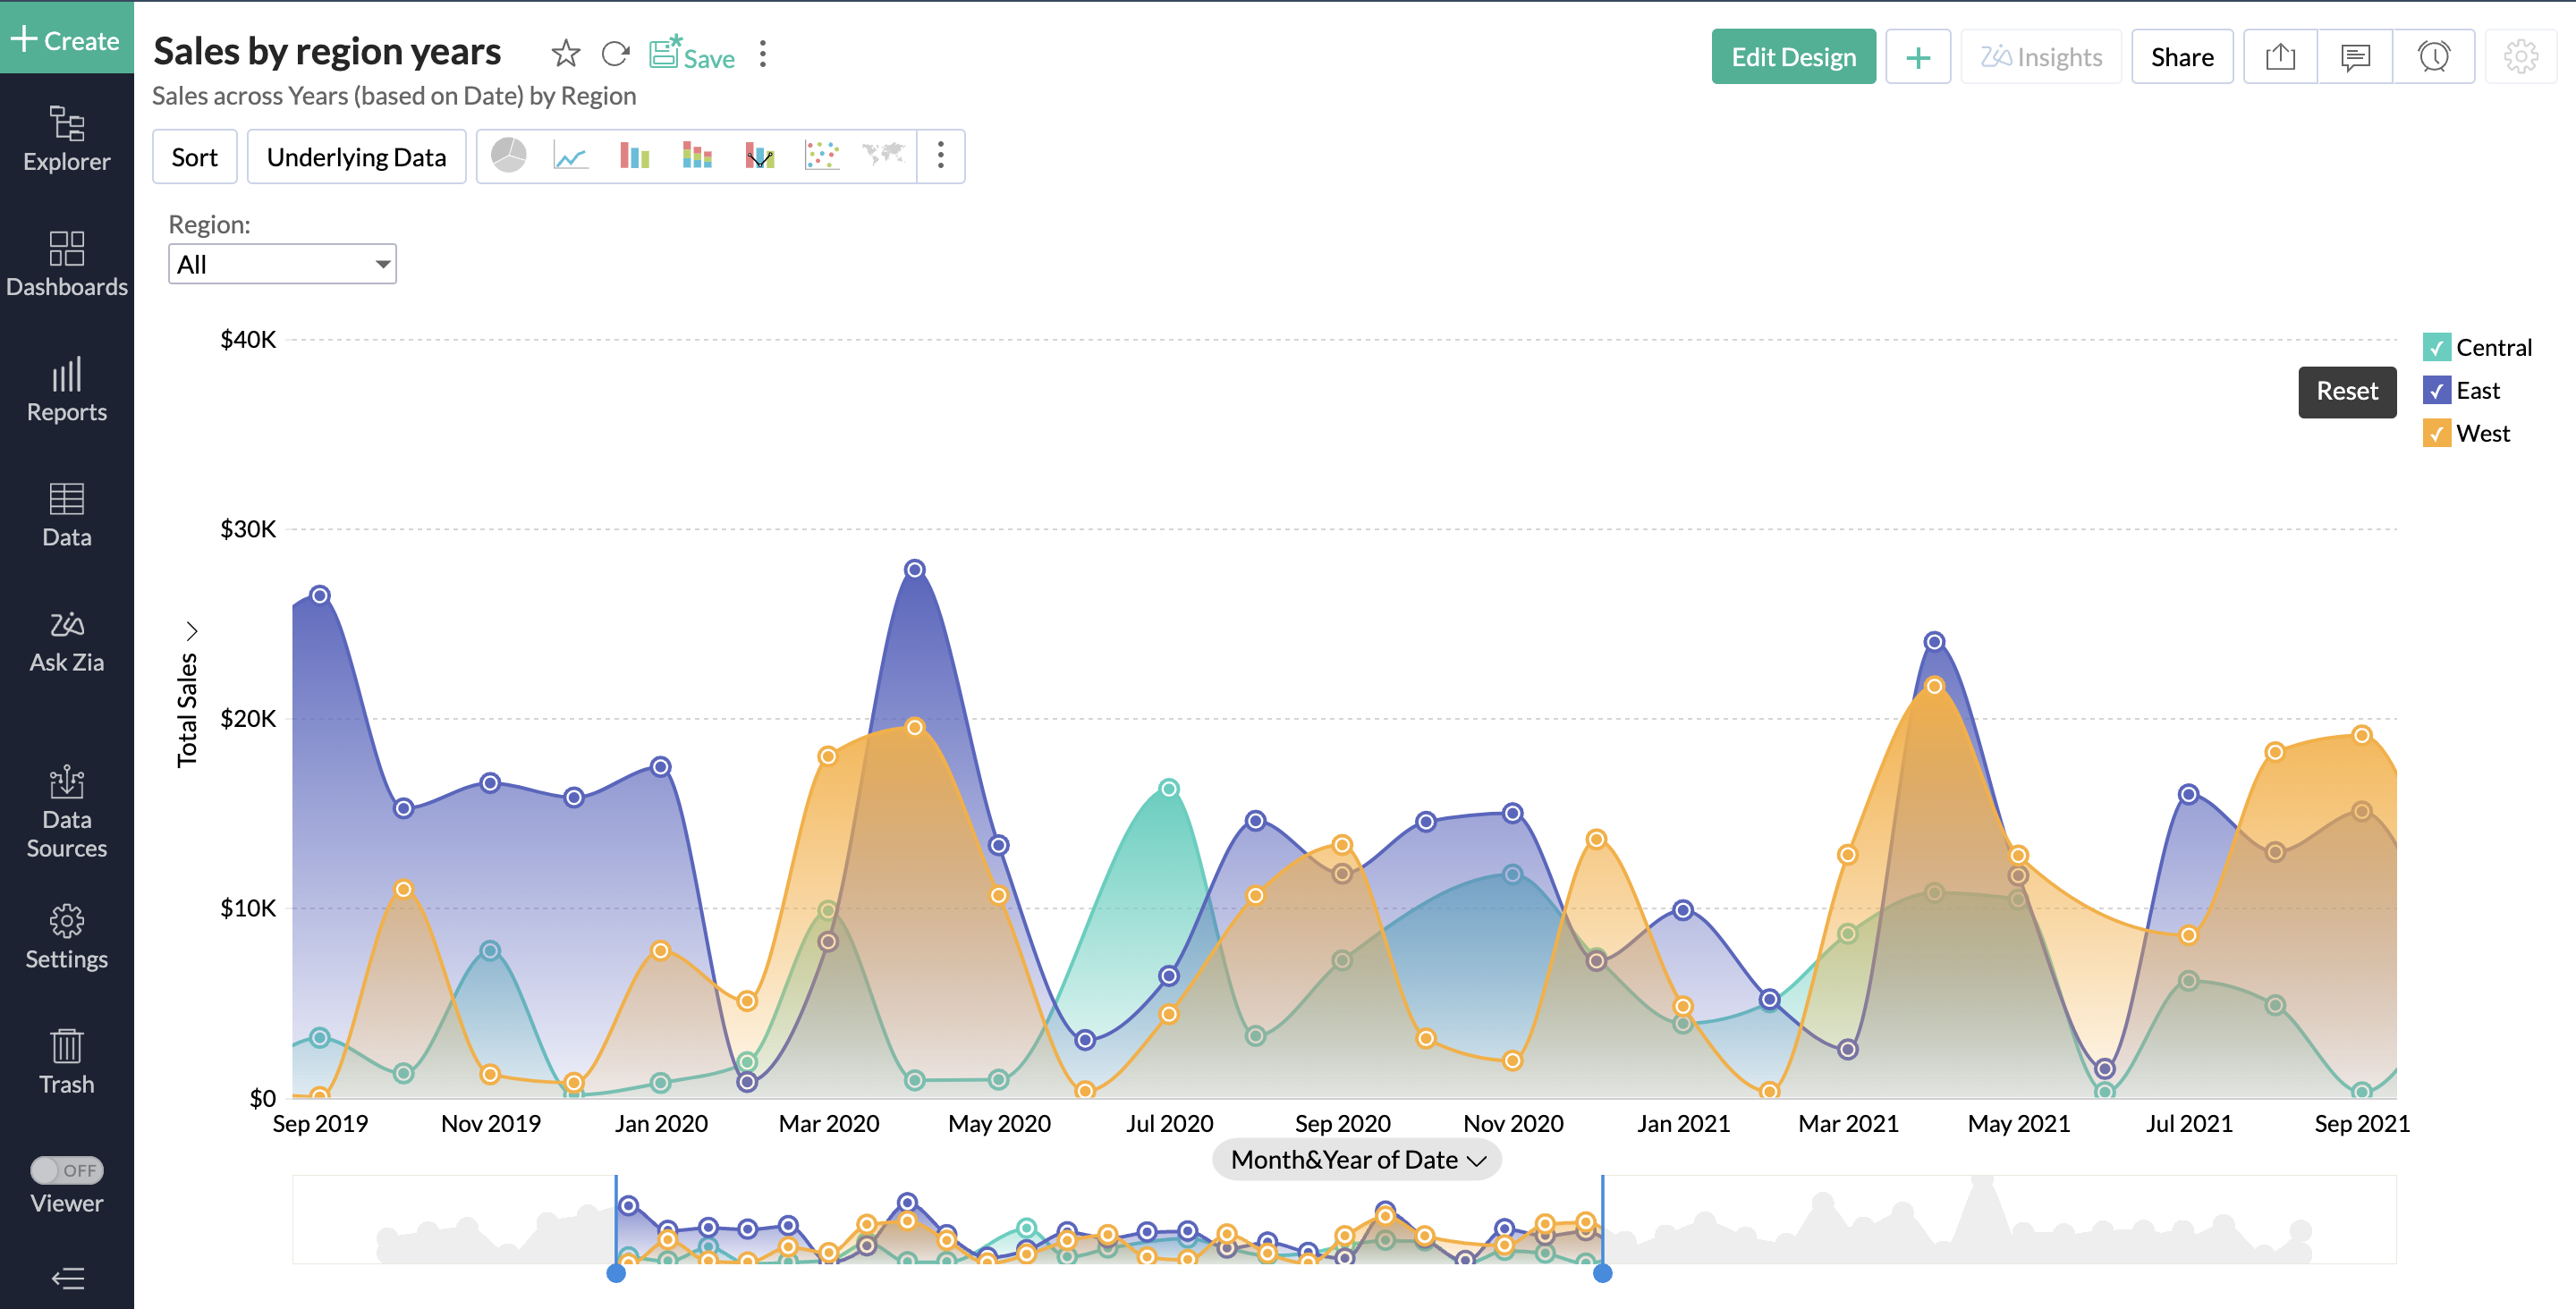
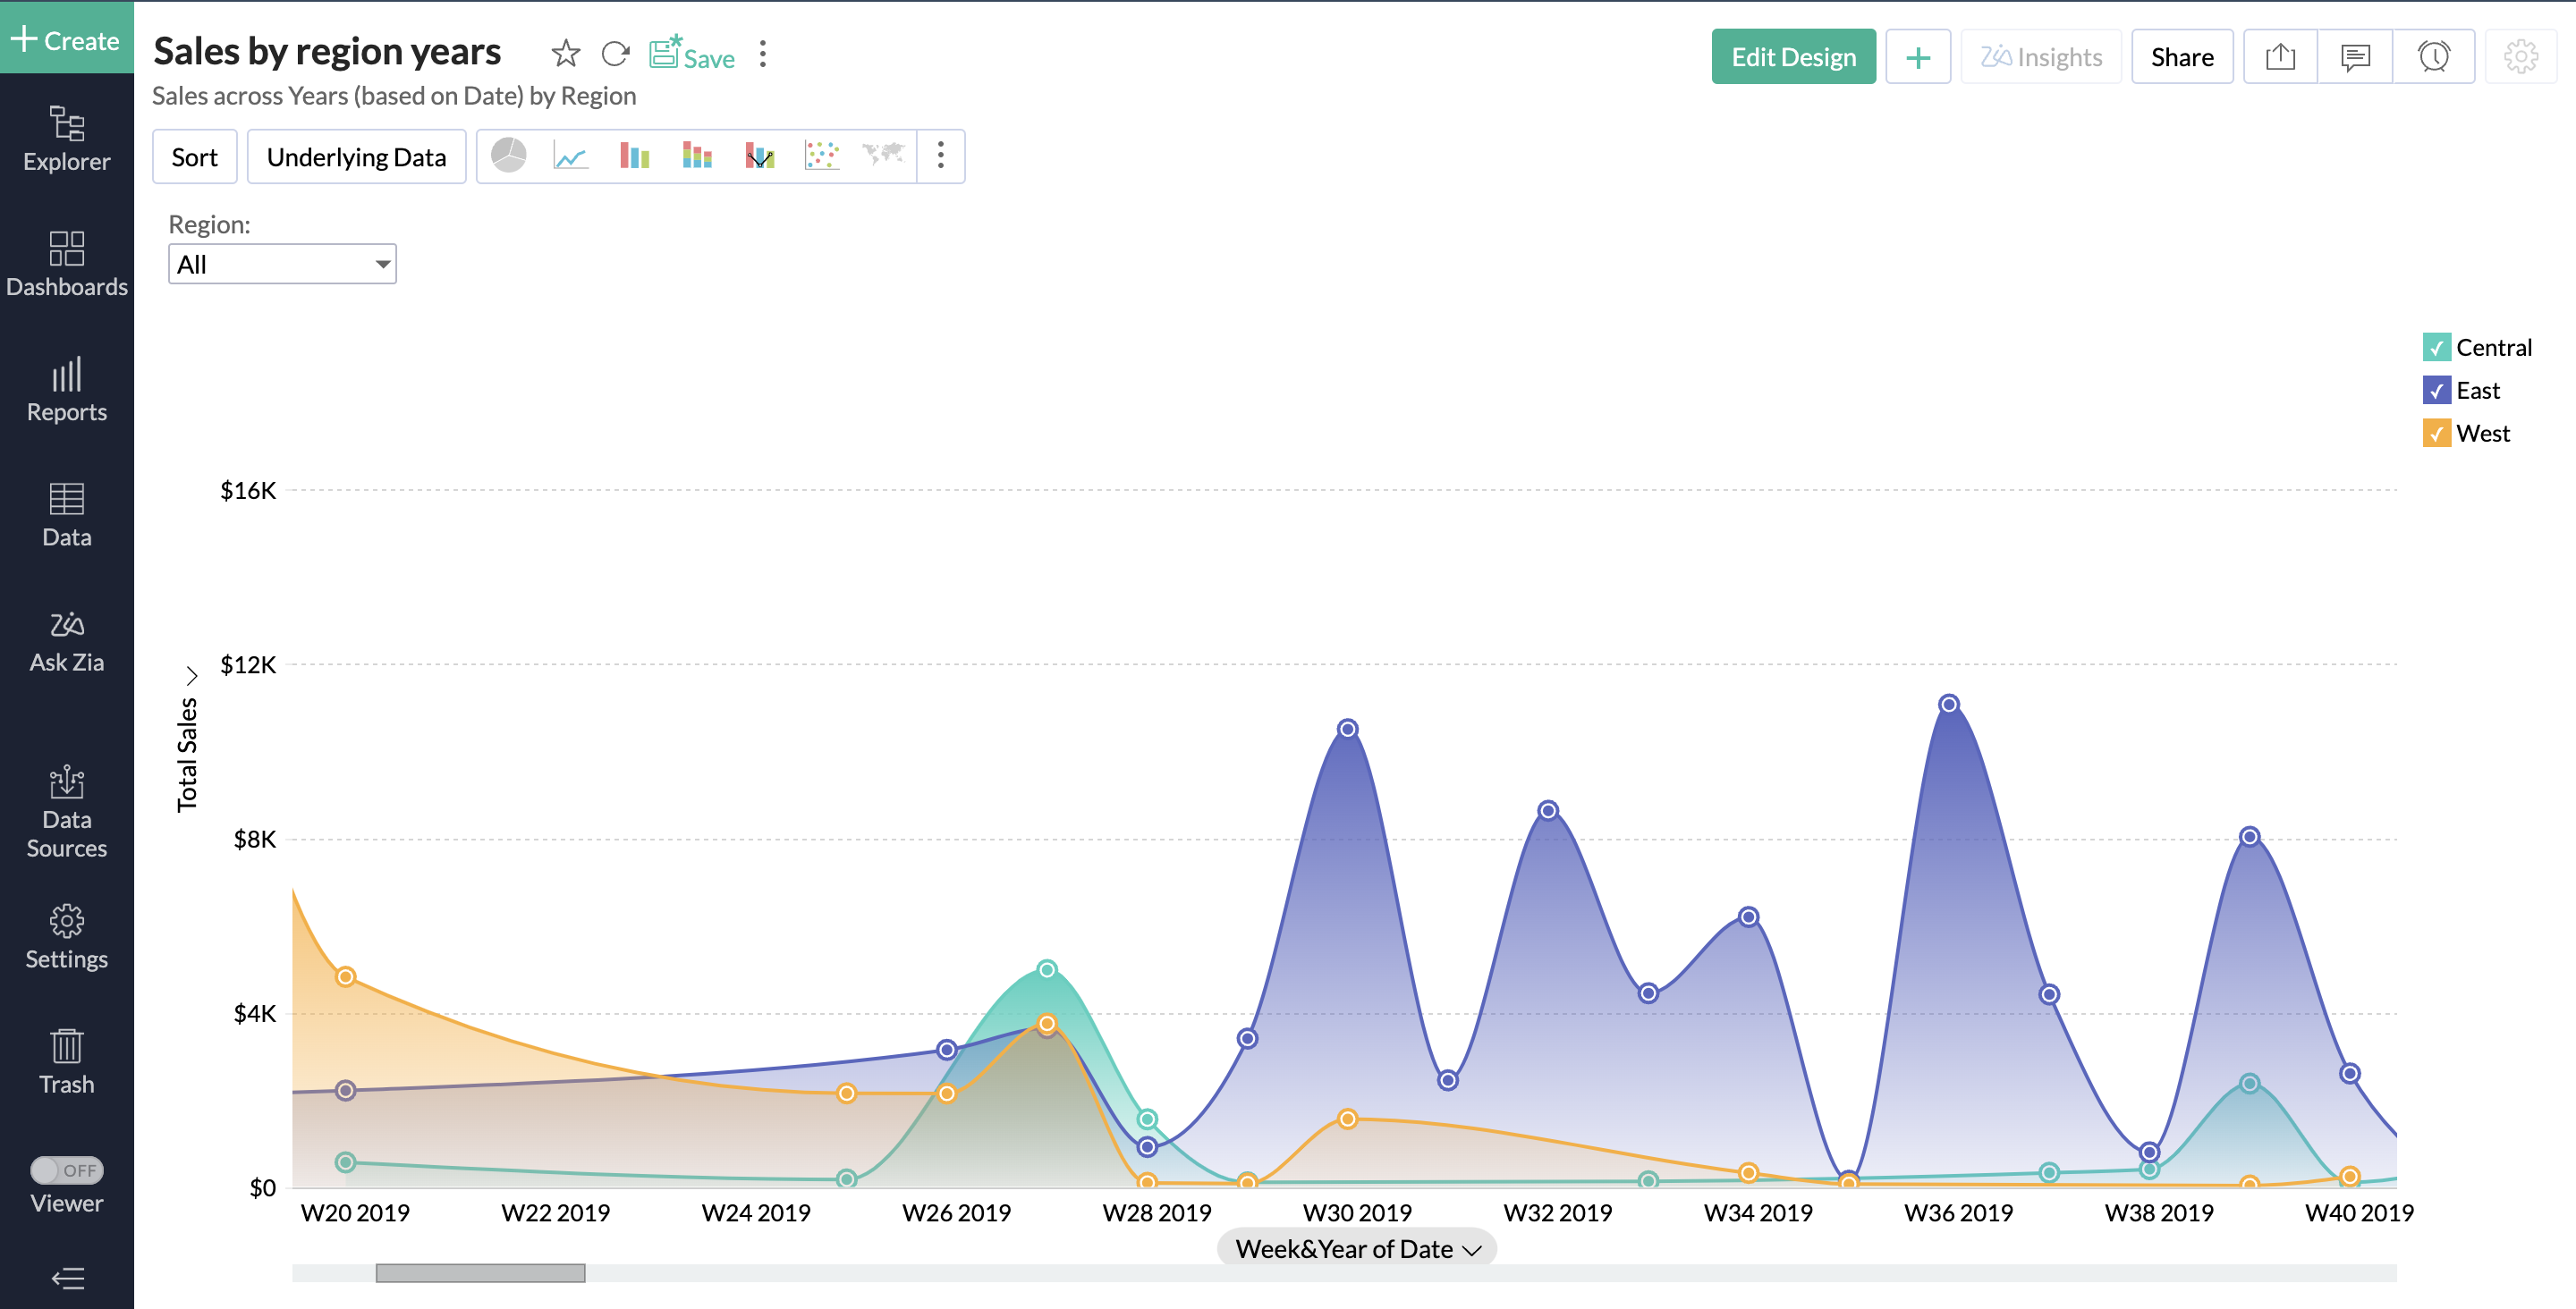
Analytics Plus now offers enhanced chart options—Overview and Scroll effects—for better visualization of reports with larger data sets.
