2021: A feature retrospective
A new year brings with it the nostalgia for the days that were, and fresh hope for the future. Join us as we reminisce about the year that was, and walk through some of the best features and updates Analytics Plus had to offer in 2021.
Fortified integrations
Over the last year, we've introduced support for additional modules across several integrations, to establish and enhance self-service analytics in varied fields.
- Desktop Central's endpoint inventory: Leverage reports on the status of software compliance, disabled bitlocker encryption, and much more.
- ServiceDesk Plus' user surveys: Wield survey analytics to improve service quality and processes, while boosting user satisfaction.
- ServiceDesk Plus and Desktop Central blended reports: With blended reports from ServiceDesk Plus and Desktop Central, you can correlate help desk incidents with endpoint behavior, and streamline IT processes.
- ServiceNow's release, change and configuration management modules: Apply the power of analytics over in-progress changes, project deployments, tasks, asset behavior, and more.
- Integrate with ServiceDesk Plus Cloud: Analyze your help desk data stored in the cloud for comprehensive insights on important help desk metrics.
Import options galore!
Analytics Plus provided flexibility over data import with an array of varied options, ranging from new local and cloud databases, to data from other Analytics Plus workspaces. You can also import large amounts of data in batches, spatial data files, and even copy views in the form of templates from different installations.
The smart assistant just became smarter
In this fast-paced world where self-sufficiency is a vital virtue, our in-house analytics assistant, Zia, has undergone several upgrades to make advanced analytics accessible and instantaneous.
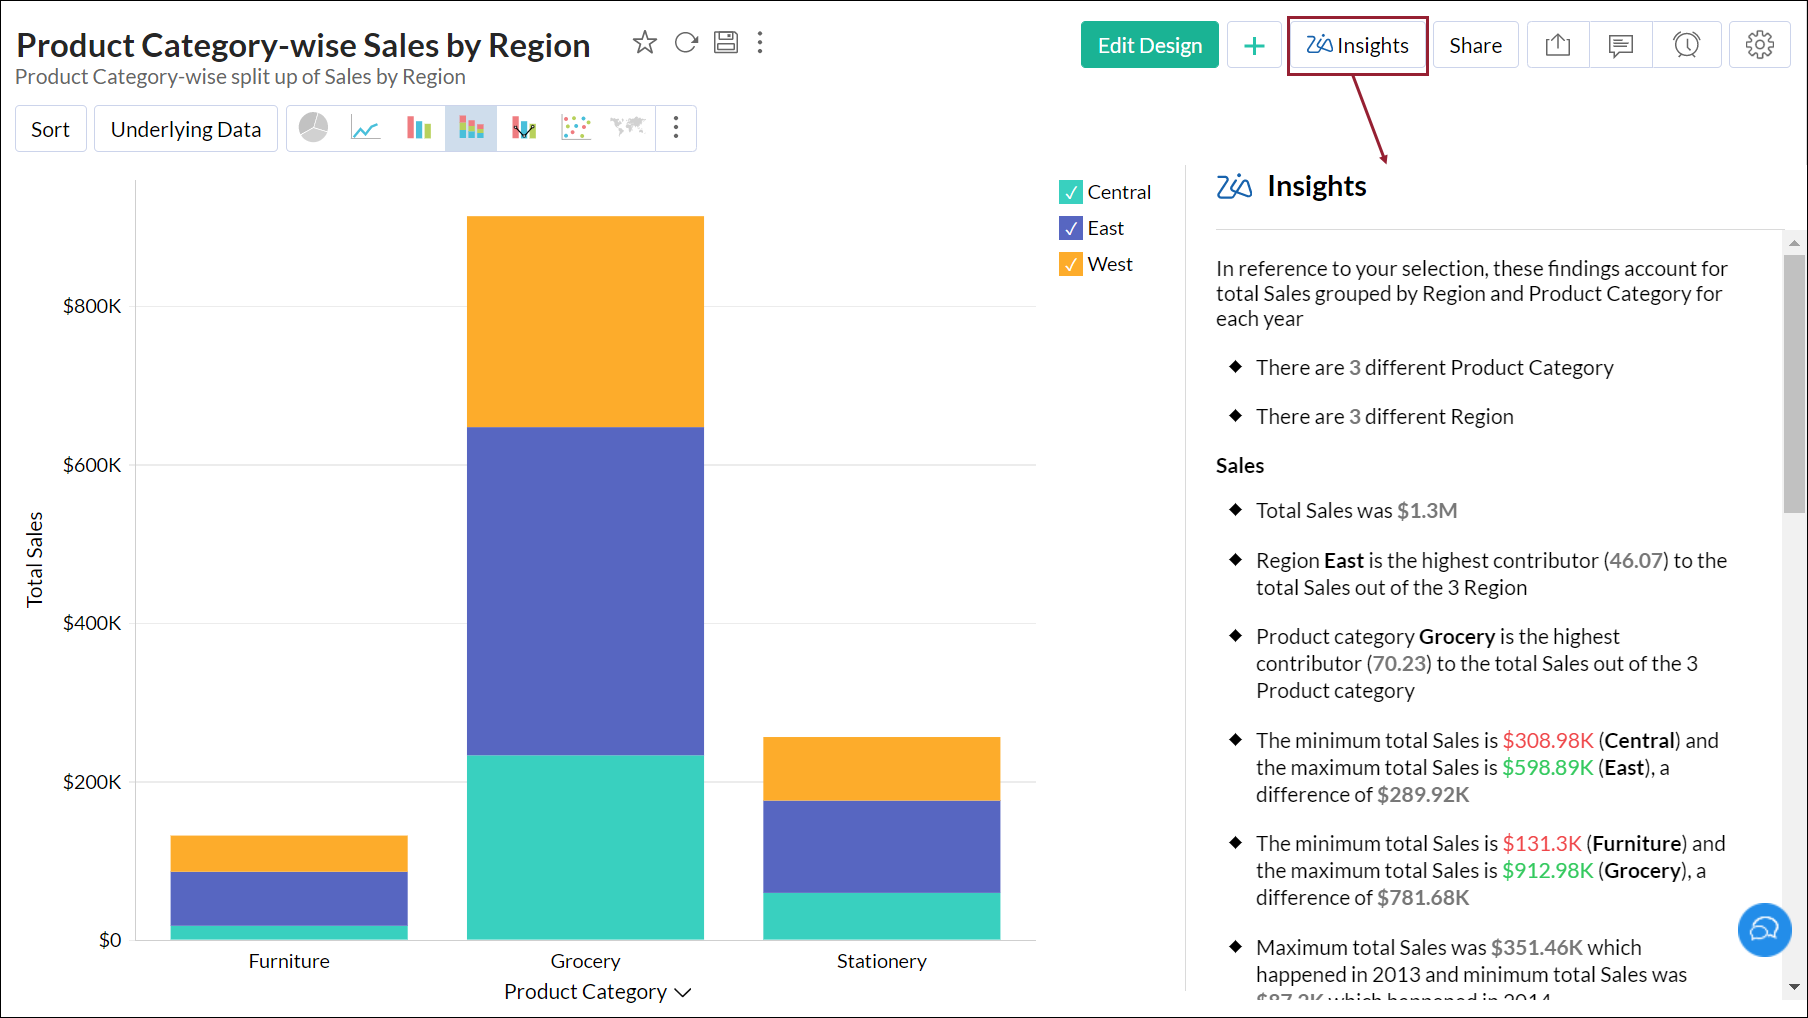
- Zia Insights: This helps you access conceptual descriptions about your reports within seconds and execute informed strategies immediately.
- Conversation mode: Perform root-cause analysis and identify breakages and lags through a mere conversation with Zia.
- Predictive analytics: Leverage Zia to generate accurate data forecasts with ease.
To learn more about Zia, click here.
Discover the power of scenario analytics
Last-minute process changes can wreck havoc to your business operations. With Analytics Plus' powerful what-if analysis functionality, you can visualize various outcomes and adjust business strategies to attain your objectives. Click here to learn more.
Tailor your data forecasts as required
Our forecasting engine now allows you to choose the forecasting model used to predict future values. You can choose to customize the mathematical model, or allow Analytics Plus to automatically compute the forecasting model that is best suited for your data. Click here to learn more about choosing the required mathematical model.
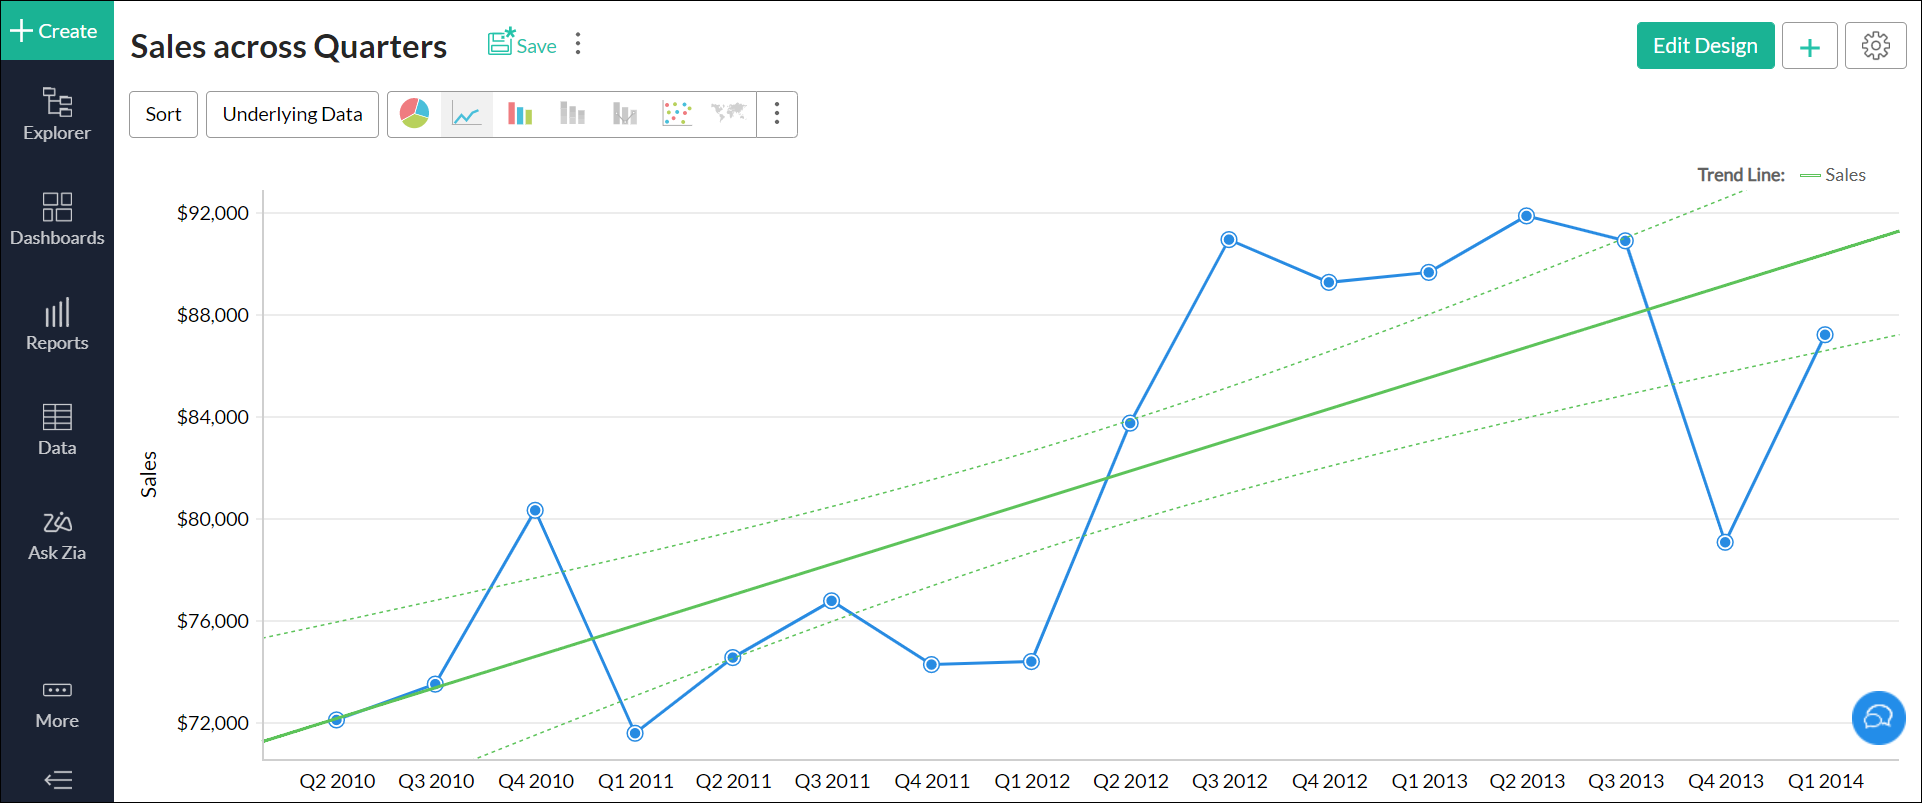
Uncover trends and patterns in your data
Analytics Plus allows you to identify and visualize past and future trends in your data series easily, facilitating ease of correlation and analysis. To plot trend lines over your data, click here.
Enhancements to charts and dashboards
We've continued to build our visual library with exciting chart types and enhancements, and extended improvements in dashboards as well.
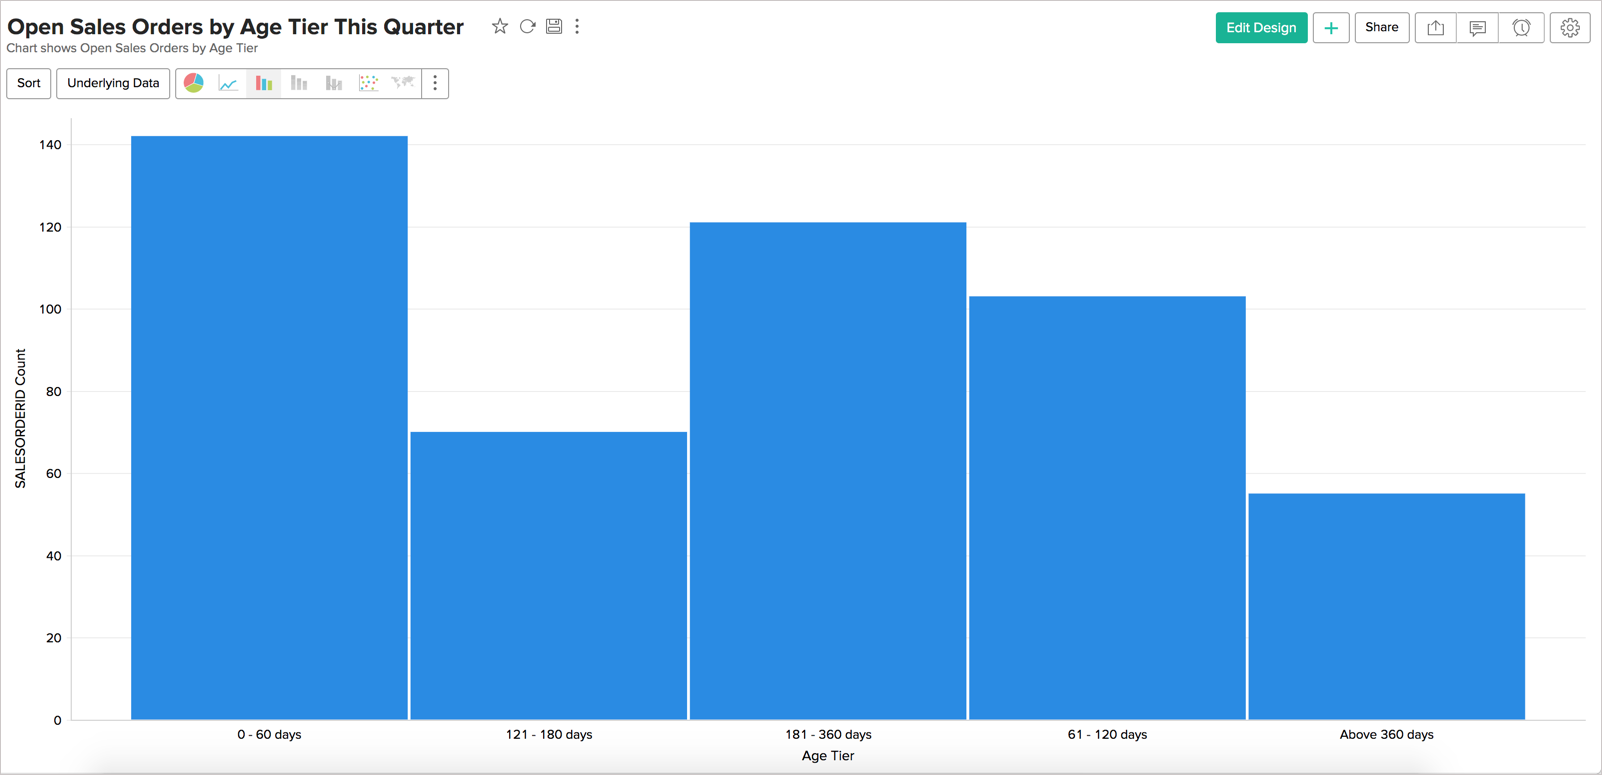
- Histogram: Beneficial while plotting frequency distributions, histograms are a variation of bar charts that plot values over continuous categories.
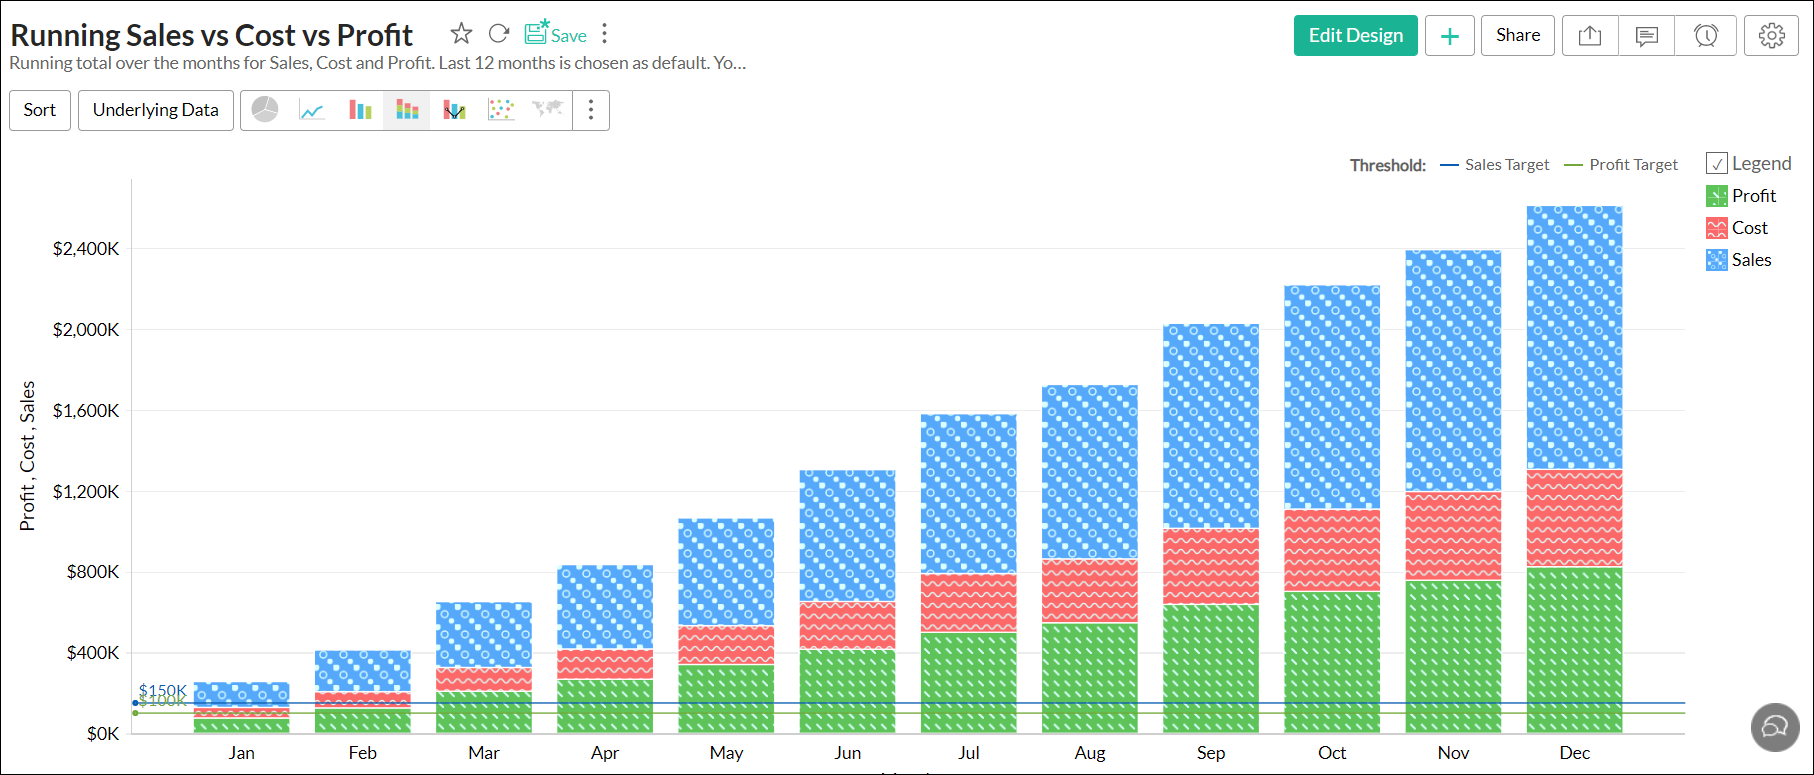
- Chart patterns: Analytics Plus allows you to apply patterns to your charts, by choosing from a range of pre-built ones or creating your own.
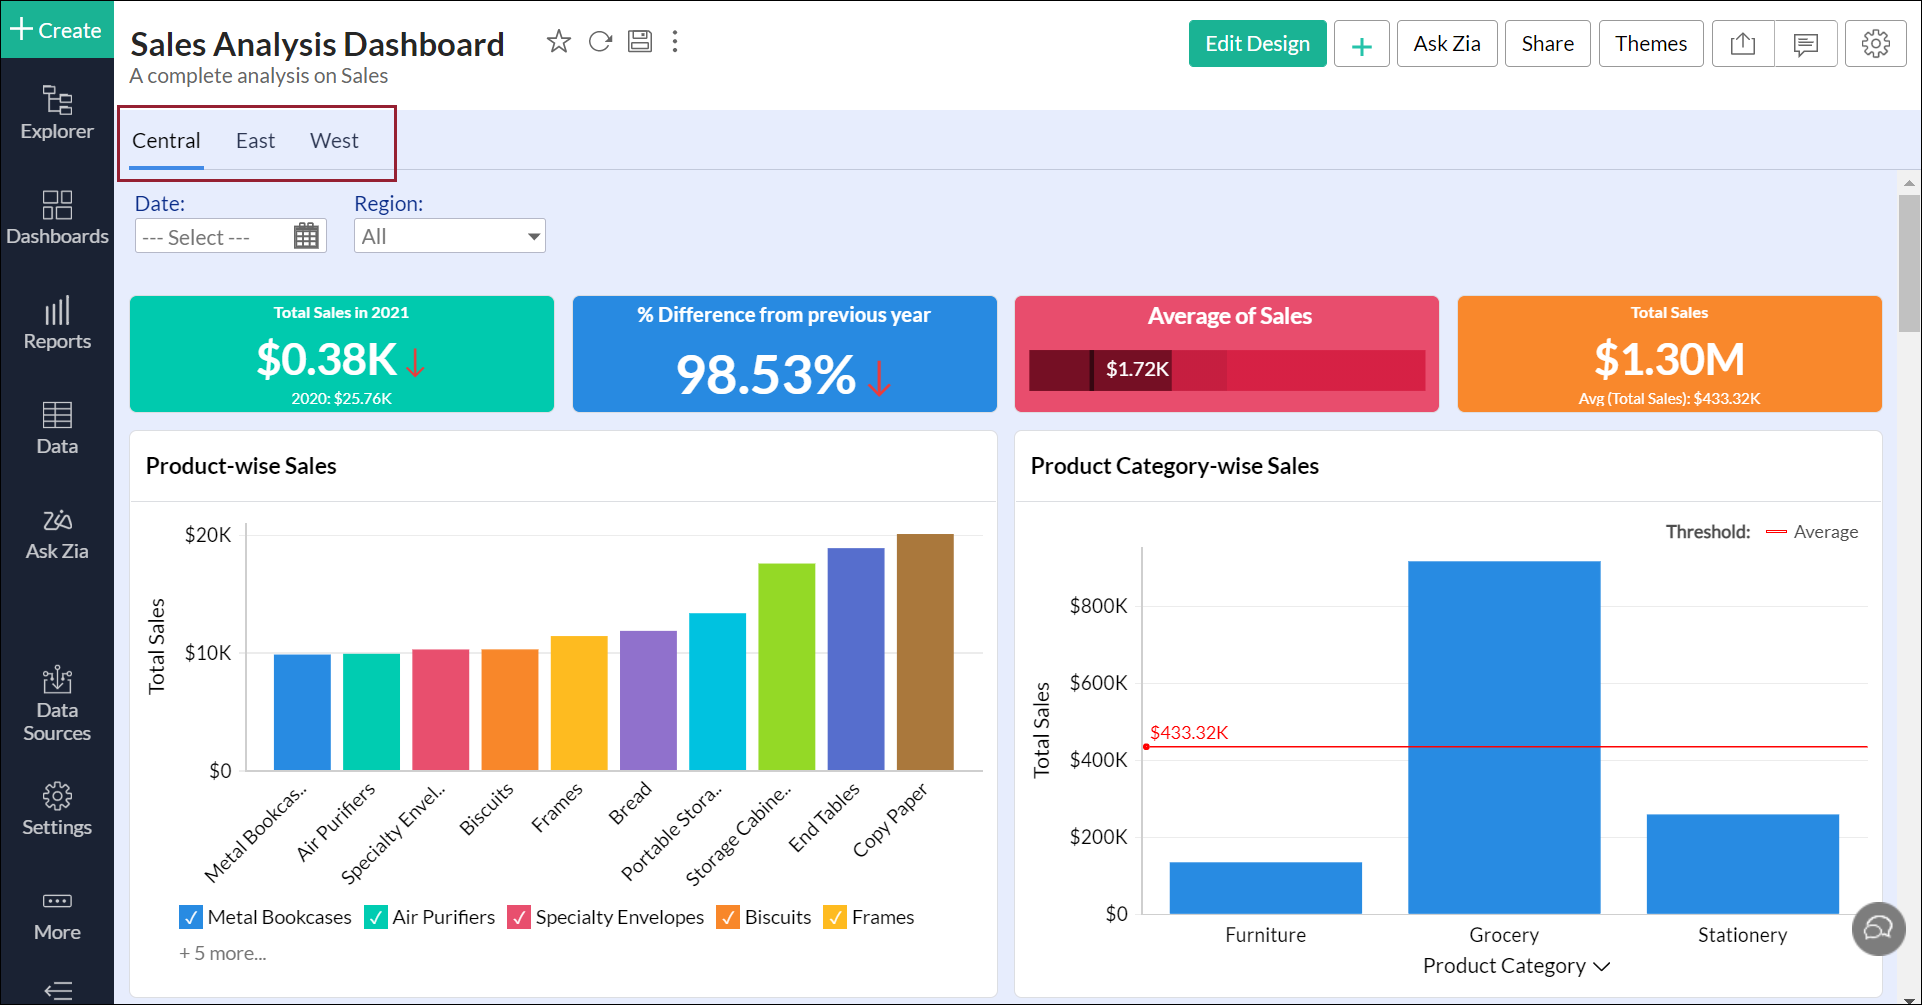
- Tabbed dashboards: Add multiple tabs to a dashboard, to better structure and organize your visualizations.
Viewer mode
With a simple flip of a button, you can instantly declutter your report or dashboard, and access to-the-point insights which proves beneficial for executives who can only spare a glance at the generated reports and dashboards.
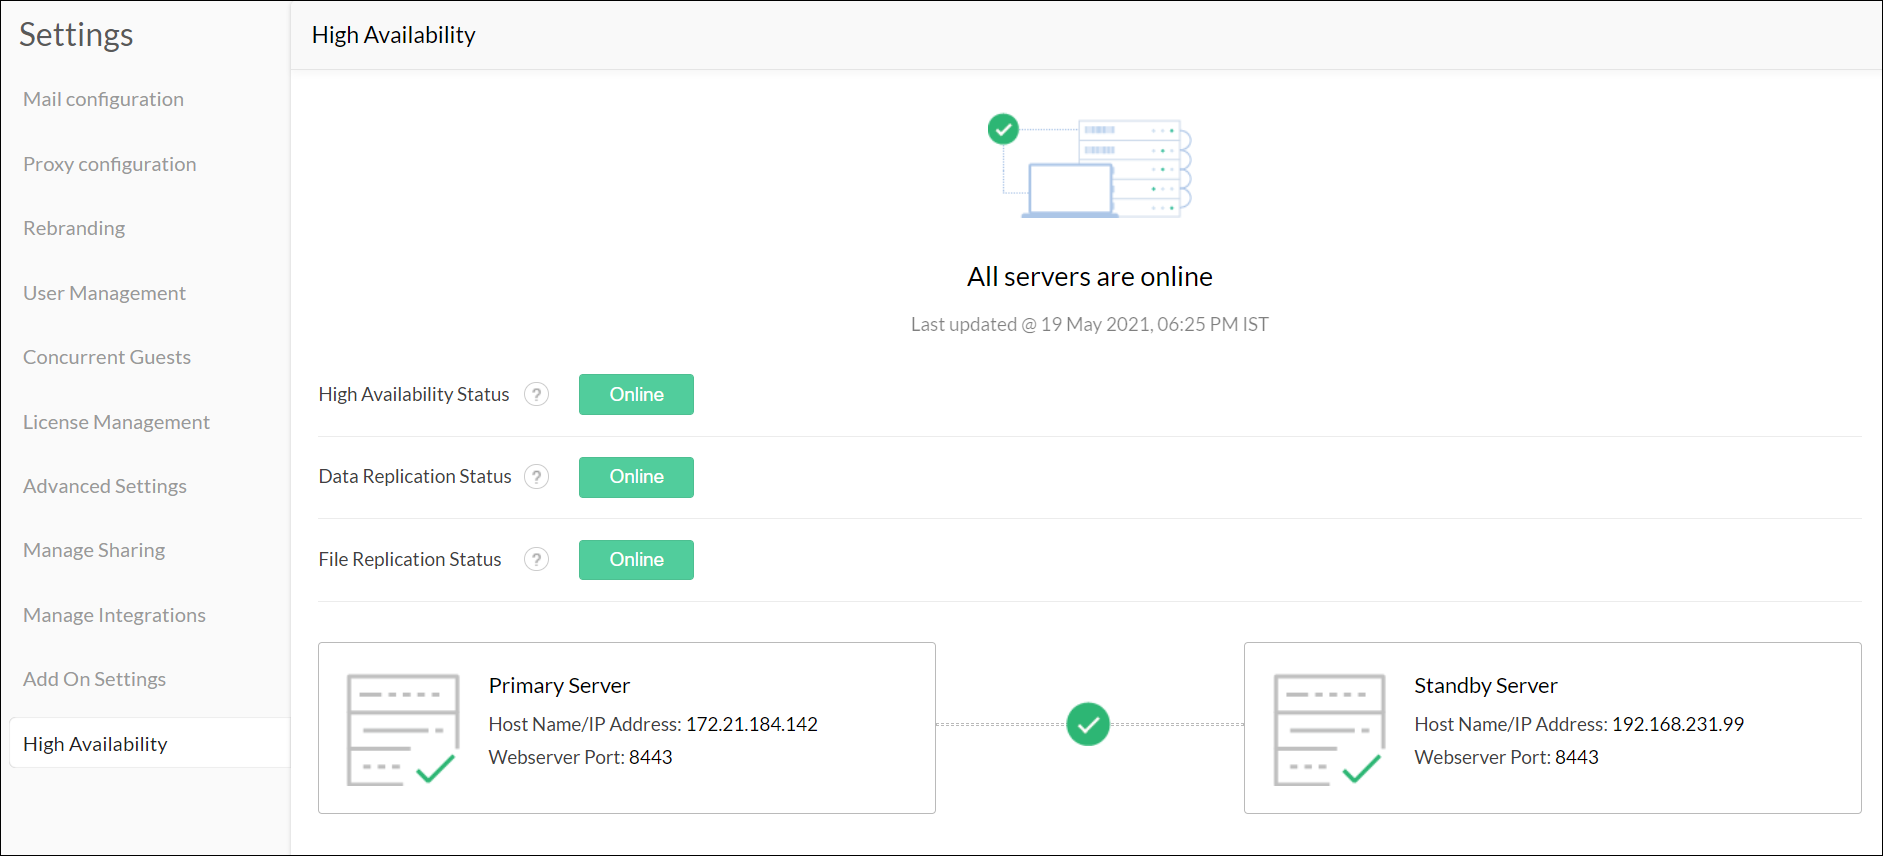
Establish application redundancy
By configuring high availability, you can avoid interruptions to your analysis journey and gain real-time insights towards building a data-driven empire. To learn more about high availability, click here.
And that's our list of the top features from 2021. As for 2022, we have an abundance of exhilarating updates in store for you. Stay tuned!
