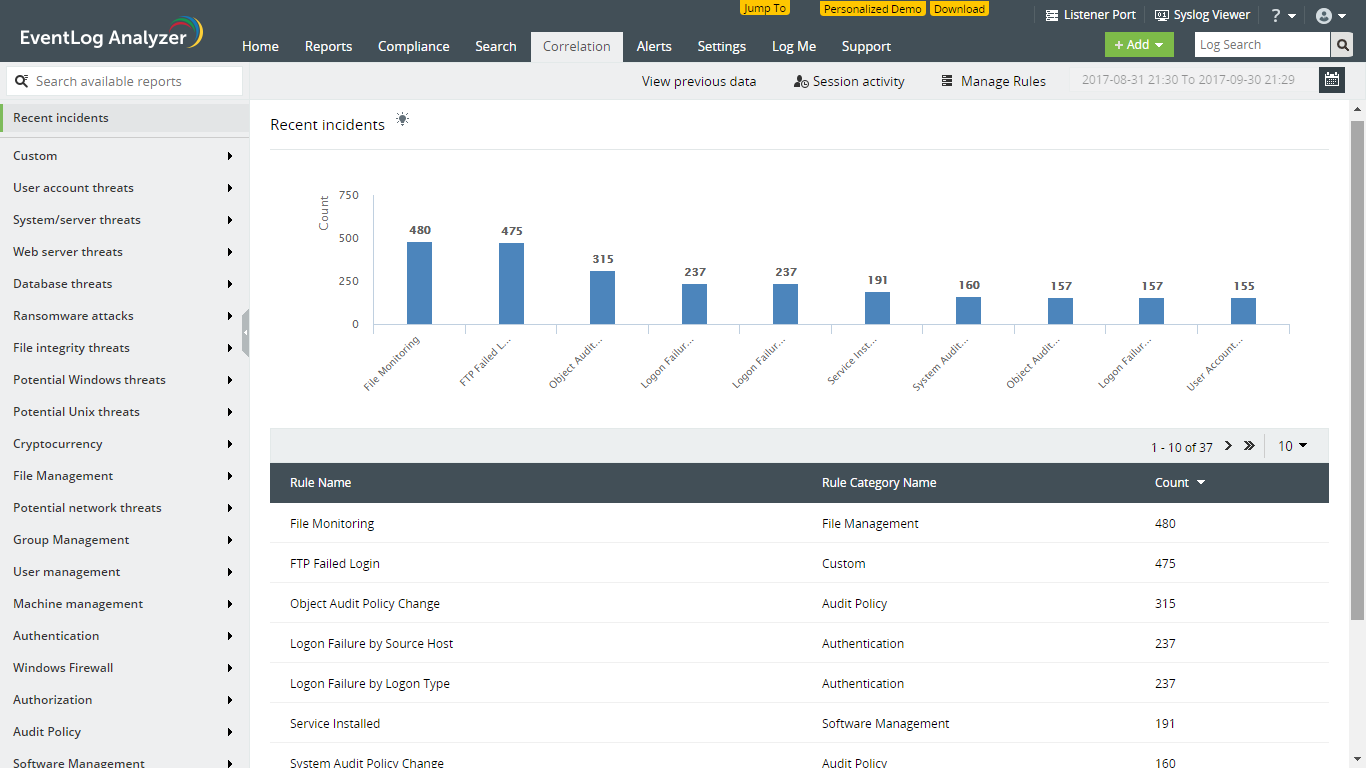
TWTQ: The correlation dashboard
Q: How do I interpret the information given in the correlation dashboard?
A: The correlation dashboard loads as soon as you select the Correlation tab on EventLog Analyzer. It gives you an overview of the various security incidents encountered on your network in a selected time period:

A security incident is detected by matching a sequence of logs to the correlation rules defined in the product. The dashboard shows you the various security incidents detected, and the total count of logs matched, or correlated, for each incident. This gives you an idea of the volume of activity related to the various incidents. You can navigate to an individual incident report by selecting the required incident, right from the dashboard.
Please note that the dashboard provides an overview for up to a maximum of 5 million correlated logs. If more than 5 million logs have been correlated in the selected time period, the dashboard does not include the information from the oldest logs. In this case, you can navigate to the individual incident reports to obtain complete information for the time period.
Learn all about SIEM event correlation and get a personal feature demo.
Topic Participants
Siddharth Sharathkumar
New to M365 Manager Plus?
New to M365 Manager Plus?
New to RecoveryManager Plus?
New to RecoveryManager Plus?
New to Exchange Reporter Plus?
New to Exchange Reporter Plus?
New to SharePoint Manager Plus?
New to SharePoint Manager Plus?
New to ADManager Plus?